
WST 4Q 2018 Commentary
“Bah! Humbug!” - Ebenezer Scrooge, A Christmas Carol
“I am an old man and most people hate me. But I don't like them either so that makes it all even.” - Henry F. Potter , It’s A Wonderful Life
Ebenezer Scrooge and Henry Potter set the tone on Wall Street in December. There was no joy in the financial markets in the fourth quarter, and those two cold-hearted and tight-fisted financiers metaphorically represent both the disregard for civility in public discourse today and the monetary squeeze facing global investment markets as central banks tighten policy.
September 2018 brought the 10th anniversary of the collapse of Lehman Brothers and the onset of the Great Financial Crisis and also marked the turning point in the current market cycle. Beginning in October, investor focus shifted from the steady, synchronized global economic growth of 2017 to the litany of challenges and risks facing the economy and markets, many of which we outlined in our letters last year. First and foremost among investor concerns is the risk that the Fed will overshoot as it seeks to normalize interest rate policy. That concern is followed closely by worries about the fallout from political and geopolitical skirmishes and trade conflicts. As the fourth quarter progressed, the challenges and concerns increased in visibility and severity, leading investors to reassess risk exposures and ratchet down return expectations. Volatility exploded, and prices fell in virtually all asset classes except bonds as the market reacted to daily and even hourly news bytes on topics ranging from Fed policy, to tariffs, to Brexit, and to turmoil in the White House. As always during periods of shifting sentiment and heightened volatility, the market fell faster than the fundamentals changed. As we discuss below, the global economic picture remains relatively positive, but the aging cycle and the withdrawal of central bank stimulus have led to inconsistent economic performance around the world. In 2019 the markets will pay close attention to the trajectory of global growth and the strength of corporate earnings.
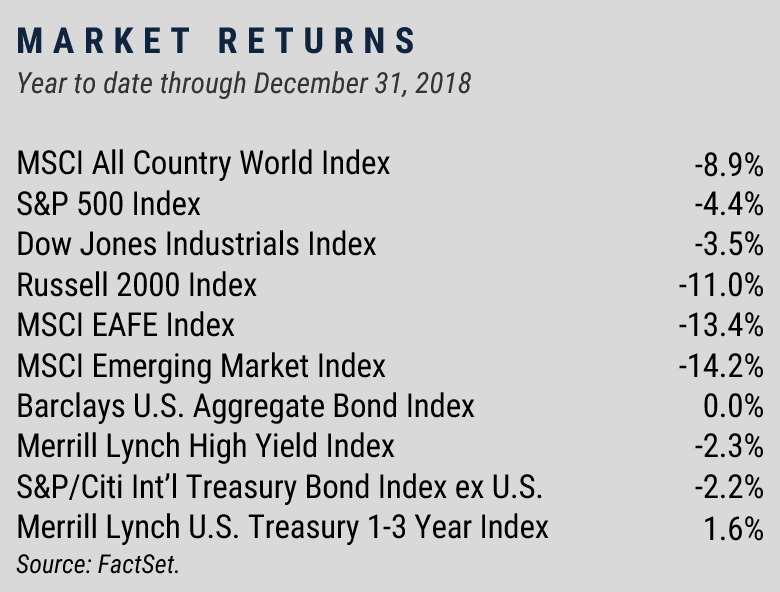
As worries grew during the quarter, we saw some shockingly negative equity market performance, particularly in December.
The S&P 500 declined 9% in the final month of the year, its most painful December ever, bringing that index’s quarterly decline to 14%, its worst quarter since the nadir of the financial crisis in late 2008. We provide more detail on stock performance later in the letter, but market action in the days around Christmas was indicative of the volatility during the quarter. Both the Dow and the S&P 500 enjoyed their biggest-ever single-day point gains on December 26, with each rising over 5%. However, those gains came on the heels of a drubbing on the 24th when both indexes suffered their worst-ever Christmas Eve declines. By the end of the year, almost every segment of the stock market including large and small companies, growth and value stocks, and domestic and foreign markets, had declined the requisite 20% from their peaks to officially enter bear market territory.
These market moves, in the absence of commensurate changes in fundamentals, reveal the new paradigm of volatility and underline the need for a disciplined investment game plan. The headline from our letter last quarter was the importance of playing defense, particularly with valuations high and sentiment widely bullish. The fourth-quarter selloff was driven by the factors we’ve discussed: trade tensions, rising interest rates, political turmoil, and the over-bought technology sector. Our conservative portfolio positioning going into the correction allows us to be patient now with an eye toward rebalancing back into equities opportunistically.
Economic Overview
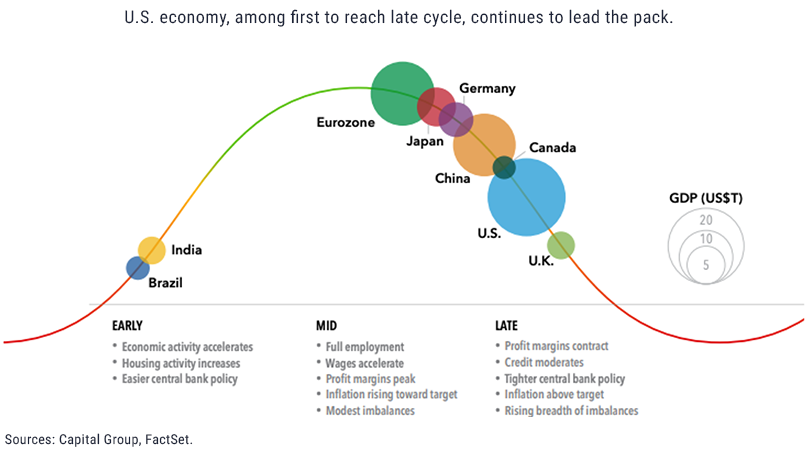
The overarching theme driving our macro outlook is the fact that all of the world's major economies are in the late stages of their economic cycles. The U.S. recovery began in June 2009 and, if it continues through next summer, it will be the longest domestic expansion in history. The global backdrop is similar. With only a few exceptions, the world’s biggest economies have benefited from the coordinated infusion of liquidity that central banks around the globe provided in response to the financial crisis. It’s impossible to predict with precision the timing of the economic cycle, but it's safe to say that we are closer to the end of this one than we are to the beginning.
The chart below from the Capital Group captures the current situation and details the characteristics of a late-stage economy: rising inflation, tighter central bank policy, less credit availability, and shrinking profit margins. All of these factors are in play in the global economy today and are the drivers of the shift in investor sentiment over the past six months. A year ago, we wrote about the unprecedented synchronization of global economic growth in 2017, when GDP in virtually every country measured by the IMF was expanding. The global economy fell out of sync in 2018 with the U.S. accelerating after opting to borrow nearly $1 trillion to fund tax cuts and Federal spending while Europe stumbled. Political risk was the dominant factor in Europe in 2018 with Brexit weighing heavily on the outlook and populisim promoting segregation rather than integration throughout the Eurozone. Most importantly China's growth continued to slow last year as the Chinese government tried to reign in off-balance sheet municipal borrowings (estimated by S&P Credit Watch to exceed $8 trillion)[1] while simultaneously working to mitigate the impact of the trade conflict.
Looking out into 2019, we expect the world's major economies to continue to diverge and global momentum to continue to weaken. Growth in the U.S. will be heavily influenced by Federal Reserve action but should continue at a reasonable clip. Europe is a wildcard until the political picture clears up. China is the biggest question mark, and the threat of a U.S.- China trade war is an important risk to the long-term outlook. As we write this letter, the U.S. and China are operating under a short-term truce announced following a meeting between President Trump and Chinese President Xi Jinping at the G20 Summit in Argentina. Trump agreed to delay the increase in the tariff rate on $200 billion worth of Chinese goods that was scheduled to take effect January 1, but this temporary reprieve is tied to a 90-day timeline during which China must take substantive steps to address U.S. allegations of forced technology transfer, intellectual property theft, and other concerns. Most experts think it unlikely that China will take any major steps to address these concerns as technological leadership is the core of the dispute between the two countries. Additional tariffs will most likely come into force in the first half of 2019.[2] While China’s economy continues to expand at a 6.5% annual pace according to the government’s official numbers, that is the slowest pace since 2009. The proposed tariffs could exacerbate the weakness already showing up in the data on Chinese loan demand, housing, and manufacturing, and if these trends continue, China’s economic struggles could export more volatility to other parts of the world.
Don’t Fight The Fed
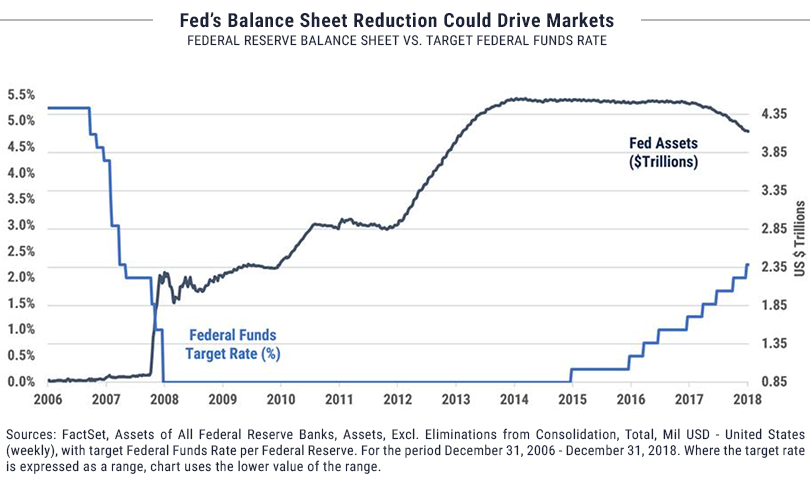
We've all heard the adage "Don't fight the Fed," and the central bank’s policy path is the most important variable and risk facing the global economy and markets in 2019. As we have often discussed, the Fed's bold action in 2008 and 2009 saved the global financial system from collapse by injecting massive amounts of liquidity into the credit markets. The Fed has two primary mechanisms at its disposal. The Fed funds rate determines the short-term interest rate at which financial institutions access money and therefore sets the rate at which businesses and consumers have access to credit. The Fed can also use its own balance sheet to create demand for longer-term bonds and thus affect interest rates for long-term borrowing. As the chart below demonstrates, the Fed put both of these tools to work in ’08-‘09, dropping short-term interest rates from 5.25% to 0% and lowering long-term rates through quantitative easing and other measures. By making money plentiful and inexpensive, the Fed created demand for houses, cars, appliances, and everything else that consumers buy on credit. Low interest rates also encouraged companies to borrow to build new plants and buy new equipment. The stimulus created the durable economic cycle we've enjoyed for a decade. More consumption led to more jobs, higher incomes and more confidence, which all lead back to more consumption. However, just as stimulative Fed policy encourages growth, tighter policy makes credit more expensive and dampens consumption and business investment. The recent shift in policy is also revealed in the chart, with short-term rates rising and the balance sheet shrinking as the bonds held by the Fed mature.
Given the influence of Fed policy on the U.S. economy, it’s understandable that the market pays close attention to the Fed's explicit and implied messages. Unfortunately Fed Chairman Jerome Powell had a challenging first year in terms of communication. The U.S. economic data offered mixed signals, and Powell was forced not only to navigate the evolving economic landscape but also to endure unusual criticism from the White House. As the fourth quarter progressed, the tone of Fed rhetoric became more dovish in response to increasing uncertainty about the direction of the economy. Where in October Powell had said that the Fed was "a long way off" from the neutral policy rate (which is defined as an interest rate level that neither stimulates nor slows the economy), Powell's more recent comments reflect an abrupt softening in perspective, and at the end of the year he said rates were "just below" neutral. Even so, the damage was done, and the market continues to worry that the Fed will take too aggressive a path. The Fed's goal is to engineer a "soft landing" with 2 to 3% GDP growth, 2% inflation, and 4 to 4.5% unemployment. Powell and the current Fed are very data-focused in their approach to setting policy, so their path in 2019 will be driven by economic progress over the course of the year. The market will watch closely for any hint that the U.S. economy is stalling as the Fed tightens.
Equity Market Overview
Global stock markets ended 2018 with their worst one-year performance since the financial crisis, and most of the damage was done during the fourth quarter. For the first nine months of the year, investors were willing to overlook the aging cycle, slowing economy, rising interest rates, political unrest in the U.S. and Europe, and our trade skirmishes with China. The fourth-quarter performance reported in the chart below reveals how quickly and dramatically investor sentiment changed. The "buy-the-dip" mentality prevalent for so long was replaced by a stampede to the exits in December as stock prices fell. The double-digit drawdown in global equities in the fourth quarter emphasizes the challenge investors face in managing expectations but also reflects the extent to which sentiment tends to shift from one extreme to another. We mentioned earlier that markets fell much faster than the fundamentals changed during the quarter, and it is worth considering that the risks facing the global economy and markets may now be appropriately priced into asset values. If the Fed moderates its path and engineers a soft landing, or if the U.S. and China come to terms on a trade deal, a sharp rally could follow.
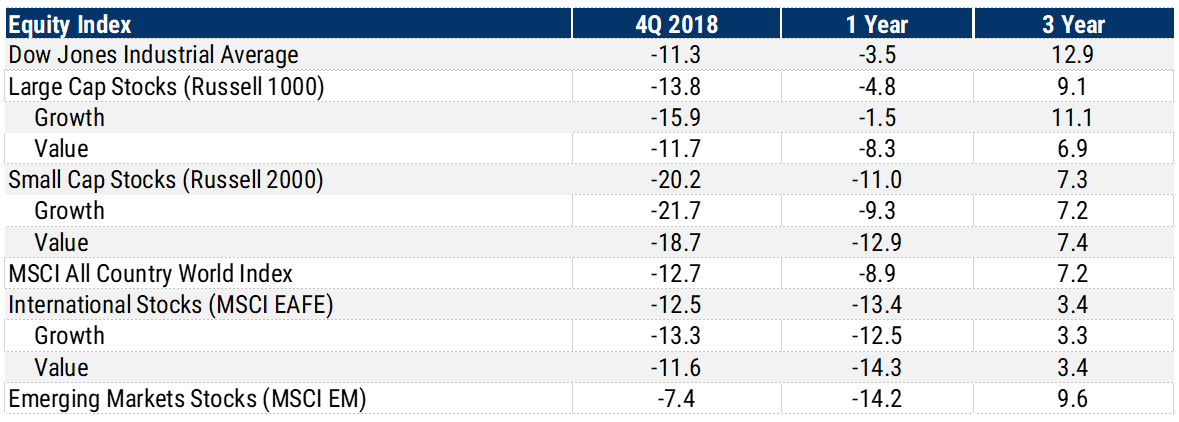
Much of our focus in the equity section of our third-quarter commentary was the outperformance of U.S. large-cap growth stocks relative to international and value stocks. We suggested that those underperforming segments of the market presented opportunities relative to the FAANGs: Facebook, Apple, Amazon, Netflix, Google. We were partially correct; international and value stocks did outperform large-cap growth stocks in the fourth quarter, but it was a matter of the FAANGs "catching down" with the others rather than international and value stocks catching up. Amazon, Apple and Netflix led the market lower in the quarter with declines of 25%, 30% and 28% respectively. Developed market international stocks (MSCI EAFE index) were down 12.5%, and emerging markets (MSCI EM index) fell “only” 7.5% for the quarter and were the best performing equity asset classes.
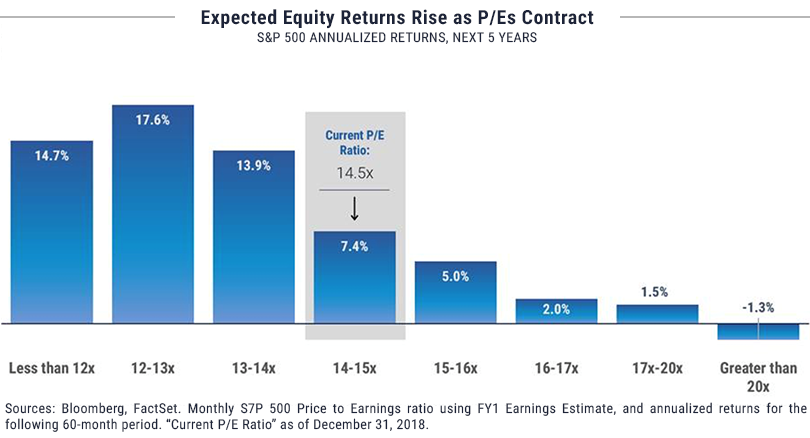
Given our uncertainty about the economic outlook, we expect market turbulence to continue in 2019. If there is any good news about the plunge in stock prices during the fourth quarter, it is that valuations are lower now, so expected returns are higher. The S&P 500 ended 2018 at 14.5 times forward earnings, well below the 17.0 multiple in January. The current multiple is lower than the 15.7 average over the past five years and the 16.1 average over the past 25 years. Of course, the risk in using forward earnings estimates as a basis for the P/E calculation is that the earnings forecast could turn out to be overly optimistic. S&P 500 earnings grew 20% in 2018 thanks to a strong tailwind from the tax bill, and the current estimate for 2019 calls for 8% growth. The earnings picture will begin to take shape in mid-January as the fourth-quarter reporting season begins, and the tone of those reports will either settle investors’ nerves after a very rocky fourth quarter or serve as a catalyst for more volatility. Either way, today’s more reasonable market valuation provides a buffer against additional downside and increases potential upside. Arguably the current environment of slower but still above-trend GDP growth justifies a market multiple higher than the long-term average instead of today’s discount. As J.P. Morgan points out, if the S&P 500 is trading at its 25-year average forward P/E ratio of 16.1 in five years, investors buying stocks today will have earned 3% year more per year than they would have three months ago.[3]
As we mentioned, the performance gap between U.S. equities and the rest of the world flipped in the fourth quarter. Domestic equities led all others by a wide margin for the first nine months of 2018 as the tax cuts boosted profits and faster growth and higher interest rates in the U.S. drove the dollar higher. Those trends reversed late in the year, and PIMCO Managing Director and global economics expert Joachim Fels cites several factors that could lead to continued outperformance by foreign stocks. U.S. financial conditions tightened considerably as the Fed raised rates last year, and the impact of fiscal stimulus will fade in 2019. The political shift brought on by the mid-term elections make additional tax cuts and spending increases unlikely. On the other hand, more fiscal stimulus is likely in China, Japan, and Europe in response to slower growth and populist pressures. Fels also points out the decline in oil prices in the fourth quarter benefits those three energy-importing economies more than it does the U.S., which now produces as much energy as it consumes.[4] The overall tone of sentiment toward non-U.S. stocks remains bearish and valuations reflect that sentiment so international stocks remain cheap relative to both the U.S. and their long-term histories. As of December 31, the All-Country World Index ex U.S. (ACWI ex U.S.) was trading at 11.5 expected 2019 earnings.
Bond Market Overview
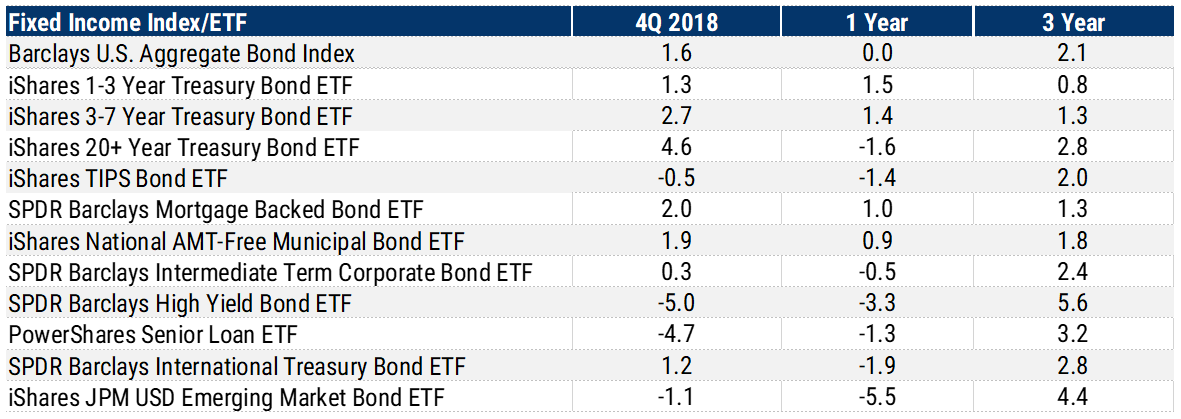
During the fourth quarter, fixed income markets wrestled with the complicated interplay among the Fed’s rate hikes, slowing economic growth, and volatile equity markets that drove investors to seek the safety of government bonds. Returns were driven primarily by Fed action on the short end of the yield curve and increasing concerns about the health of the economy at the long end. Those competing forces led to rising short rates, falling long rates, and continued flattening of the yield curve. The data in the returns table below reveal the abrupt shift in direction for fixed income returns in the fourth quarter. Credit-sensitive sectors, including high-yield and bank loans, had provided the highest returns coming into the market correction and were hit hardest by the flight to quality in the last three months of the year. Long-term bonds, which suffered as rates rose earlier in the year, provided the best returns in the quarter as the flight to quality and diminished inflation expectations led to more demand and higher prices for longer maturities.
With the Fed funds rate now in the 2.25-2.50% range, cash and cash equivalents provide a reasonable alternative to longer-dated fixed income securities. The one-month Treasury bill offered a yield of 2.4% at year-end, up over 1% from December 2017. One percent may not sound like much, but the increase almost doubled the return available on risk-free assets and makes cash a viable portfolio holding after years of zero interest rates. The yield on the 10-year Treasury note, which serves as a benchmark for many consumer and business loans, peaked at a multi-year high of 3.24% on November 8 but plummeted to 2.7% by the end of the year.
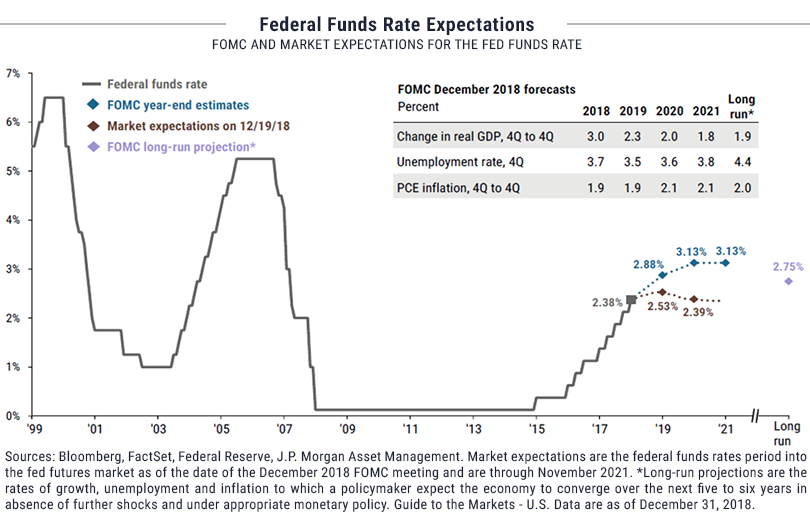
The Wall Street Journal points out that the flat Treasury yield curve is a warning signal about the health of the economy. The "2 yr./10 yr. spread,” which is the gap between shorter and longer-term interest rates, fell to less than 0.1% in December, and every time the two-year yield has exceeded the 10-year yield since 1975, a recession has followed within 6 to 18 months.[5] At risk of redundancy but like so much of our view, our outlook on fixed income for 2019 is focused on the action of the Fed. The moment of truth is at hand when the Fed will decide between sticking with its long-scripted plan to continue raising rates in 2019 or pause in light of the slowing growth and high volatility of the fourth quarter. The gap between FOMC estimates of its future path and the path expected by the markets as measured by the Fed-funds futures has widened, and the Fed’s decision on whether to pause at the current level, which is what the money market forward contracts are predicting, or continue to hike in 2019 will be a big driver of both the stock and bond markets over the course of the next 12 months. On January 2, the futures market showed a 91% probability that the Fed will end 2019 with interest rates at or below the current level, a big reversal from November, when the futures estimated a 90% likelihood of additional rate hikes this year.[6] The chart on the following page details the gap between the Fed's estimate and the market’s.
With the yield curve having flattened further in the quarter, our aversion to long maturity bonds has only increased. Given the slowdown in economic growth and shift in tone by the Fed, we expect at most a moderate pace of rate hikes and continued low inflation. Interest rates will likely remain range-bound until a significant data shift in one direction or another.
Our response to the fourth-quarter equity market volatility is to maintain discipline with an eye toward rebalancing portfolio exposures as appropriate for each specific client's needs. Every individual and institution has unique return expectations and tolerances for volatility, and there is no "one-size-fits-all" portfolio mix for any market environment. In fact, periods of market turmoil afford individual investors and investment committees the opportunity to stress test their investment policies and be sure that those policies align with their needs. After years of low volatility and strong returns, complacency had become a factor for many investors, and the fourth-quarter market action has prompted good discussions with many clients. To the extent that our view has been cautious for several years, our portfolios were reasonably protected from downside in the fourth quarter, but the market declines were fast and severe enough to catch many investors off-guard. Normally we tend to view stock-market drawdowns as opportunities to buy equities cheaply, but the prospect of decelerating earnings growth and the late stage of the business cycle have caused us to hesitate this time. We will be rebalancing selectively, especially in cases where we have been waiting for an opportunity to put new money to work, but we remain patient and cautious as risks and uncertainty continue to increase. We look forward to the opportunity to work with you as 2019 evolves. As always, our top priority is ensuring that the structure and performance of your portfolio meets your needs and expectations.
[1] https://tradingeconomics.com/china/gdp-growth-annual
[2] Global Outlook Summary, The Economist, January 2019
[3] Kelly, David P., “The Investment Implications Of the Stock Markey Swoon,” NotesOn The Week Ahead, December 31, 2018.
[4] Fels, Joachim, “This Will Be The Year U.S. Exceptionalism Fades For Investors,” Financial Times, January 3, 2019.
[5] Kruger, Daniel, “Bond Market Faces Greater Volatility in New Year,” The Wall Street Journal, January 1, 2019.
[6] Kruger, Daniel, “Investors Bet Fed Rates Stay Put,” The Wall Street Journal, January 3, 2019.
Important Disclosures
Unless otherwise indicated, performance information for indices, funds and securities as well as various economic data points are sourced from FactSet as of December 31, 2018. This newsletter represents opinions of Wilbanks, Smith and Thomas Asset Management, LLC that are subject to change and do not constitute a recommendation to purchase or sell any security nor to engage in any particular investment strategy. The information contained herein has been obtained from sources believed to be reliable but cannot be guaranteed for accuracy. This material is proprietary and being provided on a confidential basis, and may not be reproduced, transferred or distributed in any form without prior written permission from WST. WST reserves the right at any time and without notice to change, amend, or cease publication of the information. This material has been prepared solely for informative purposes. It is made available on an "as-is" basis without warranty. There are no guarantees investment objectives will be met.
This newsletter represents opinions of Wilbanks, Smith and Thomas Asset Management, LLC and are subject to change from time to time, and do not constitute a recommendation to purchase or sell any security nor to engage in any particular investment strategy. This material is proprietary and being provided on a confidential basis, and may not be reproduced, transferred or distributed in any form without prior written permission from WST. WST reserves the right at any time and without notice to change, amend, or cease publication of the information. This material has been prepared solely for informative purposes. The information contained herein includes information that has been obtained from third party sources and has not been independently verified. It is made available on an "as is" basis without warranty. There are no guarantees investment objectives will be met.
The information contained herein has been obtained from sources believed to be reliable but cannot be guaranteed for accuracy.
Market indices are unmanaged and do not reflect the deduction of fees or expenses. You cannot invest directly in an index such as these and the performance of an index does not represent the performance of any specific investment strategy. We consider an index to be a portfolio of securities whose composition and proportions are derived from a rules based model. Market indices are unmanaged and do not reflect the deduction of fees or expenses. You cannot invest directly in an index such as these and the performance of an index does not represent the performance of any specific investment strategy.
The S&P 500 Index is a market capitalization weighted index, including reinvestment of dividends and capital gains distributions that is generally considered representative of U.S. stock market. The Dow Jones Industrial Average (DJIA) is a price-weighted average of 30 significant stocks traded on the New York Stock Exchange (NYSE) and the NASDAQ. The MSCI ACWI Index is a free float-adjusted market capitalization weighted index that is designed to measure the equity market performance of developed and emerging markets. The MSCI ACWI ex USA Index is designed to provide a broad measure of stock performance throughout the world, with the exception of U.S.-based companies. The MSCI EAFE Index is a stock market index that is designed to measure the equity market performance of developed markets outside of the U.S. & Canada. It is maintained by MSCI Barra, a provider of investment decision support tools; the EAFE acronym stands for Europe, Australasia and Far East. The MSCI Emerging Markets Index captures large and mid cap representation across 24 Emerging Markets (EM) countries. With 845 constituents, the index covers approximately 85% of the free float-adjusted market capitalization in each country. The Russell 2000 index measures the performance of the 2,000 smallest companies in the Russell 3000 index. The Bloomberg Barclays U.S. Aggregate Bond Index covers the USD-denominated, investment-grade, fixed-rate, taxable bond market of SEC-registered securities. The index includes bonds from the Treasury, Government-Related, Corporate, MBS, ABS, and CMBS sectors. The BofA Merrill Lynch U.S. High Yield Index tracks the performance of U.S. dollar denominated below investment grade corporate debt publicly issued in the U.S. domestic market. Qualifying securities must have a below investment grade rating (based on an average of Moody’s, S&P and Fitch), at least 18 months to final maturity at the time of issuance, at least one year remaining term to final maturity as of the rebalancing date, a fixed coupon schedule and a minimum amount outstanding of $250 million. The BofA Merrill Lynch 1-3 US Year Treasury Index is an unmanaged index that tracks the performance of the direct sovereign debt of the U.S. Government having a maturity of at least one year and less than three years. The S&P/Citigroup International Treasury Bond ex-U.S. Index measures the performance of treasury bonds, with maturities greater than or equal to one year, issued by non-U.S. developed market countries.
Besides attributed information, this material is proprietary and may not be reproduced, transferred or distributed in any form without prior written permission from WST. WST reserves the right at any time and without notice to change, amend, or cease publication of the information. This material has been prepared solely for informative purposes. The information contained herein may include information that has been obtained from third party sources and has not been independently verified. It is made available on an “as is” basis without warranty. This document is intended for clients for informational purposes only and should not be otherwise disseminated to other third parties. Past performance or results should not be taken as an indication or guarantee of future performance or results, and no representation or warranty, express or implied is made regarding future performance or results. This document does not constitute an offer to sell, or a solicitation of an offer to purchase, any security, future or other financial instrument or product.