
December 2018 Fixed Income Markets Review
Fixed income broad markets delivered a strong close to 2018, with yields falling across core indices and sectors as global equities entered a tailspin driven by heavy losses in the US. A global bond rally that began in the prior month intensified throughout December, and the +2.02% return was sufficient to recover nearly two-thirds of the year-to-date losses that occurred through November. The Bloomberg Barclays Global Aggregate Index closed out the year at -1.20%.
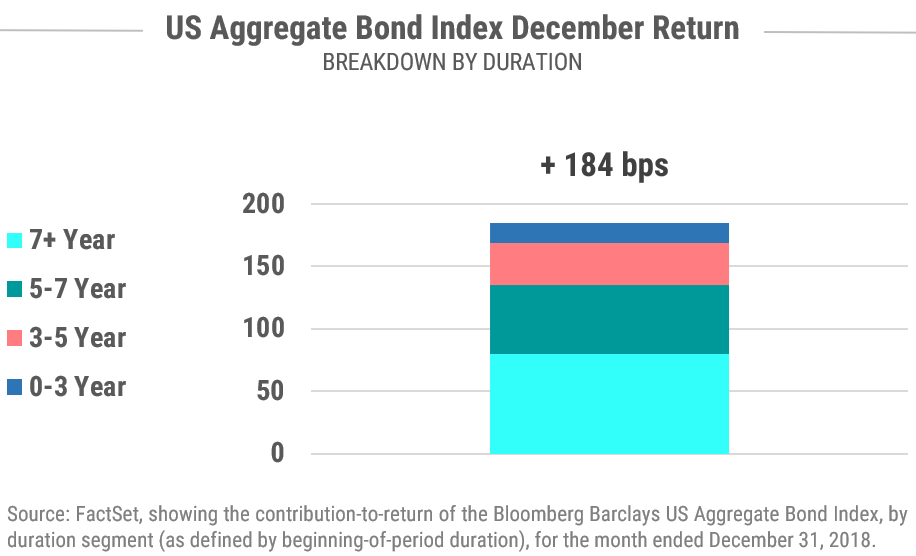
The Bloomberg US Aggregate Bond Index rose 1.84%, sufficient to notch a strong quarterly result and close out the year exactly flat. Contrary to 2018’s overall pattern, which favored shorter-dated and floating-rate fixed income, longer-dated bonds drove results in December.
US credit saw mixed results between investment-grade and junk. After coming under some pressure earlier in the quarter due to mounting concerns about credit quality and ballooning corporate debt overall, investment-grade participated in the rally and the AA corporate segment posted a gain on par with broad markets. Returns were positive, but weaker, further down the rating scale. High yield continued to struggle in tandem with equities and the month’s result (-2.14%) ultimately erased the last of the year’s gains and saw the index finish 2018 down 2.07%.
Results were positive outside the US as well. Rallies in Europe overall served to cut quarterly losses, with 4Q setting most indices back by less than 50 basis points. The S&P Eurozone Developed Sovereign Bond Index added 178 basis points, rallying alongside US treasuries and as core inflation fell alongside oil prices and industrial production – factors that, in aggregate, may stall tightening by European central banks.
December capped a breakaway quarter for emerging sovereign bonds. In the prior month, EM investors seemed cheered by the notion that the US Fed was prepared to pump the brakes on rate-hikes, possibly deferring global portfolio rebalancing (i.e., into the US and away from higher-risk emerging issues) and softening the dollar in the process. December saw a further reward for Fed action and the more agreeable currency environment. Emerging sovereigns posted a gain of 1.66% to top off a strong 4Q, and the ICE BofAML Emerging Sovereign Bond Index posted a 3.62% quarterly return to end the year down around 105 basis points. Read more of our market updates by visiting the WST blog.
Notes and Disclosures
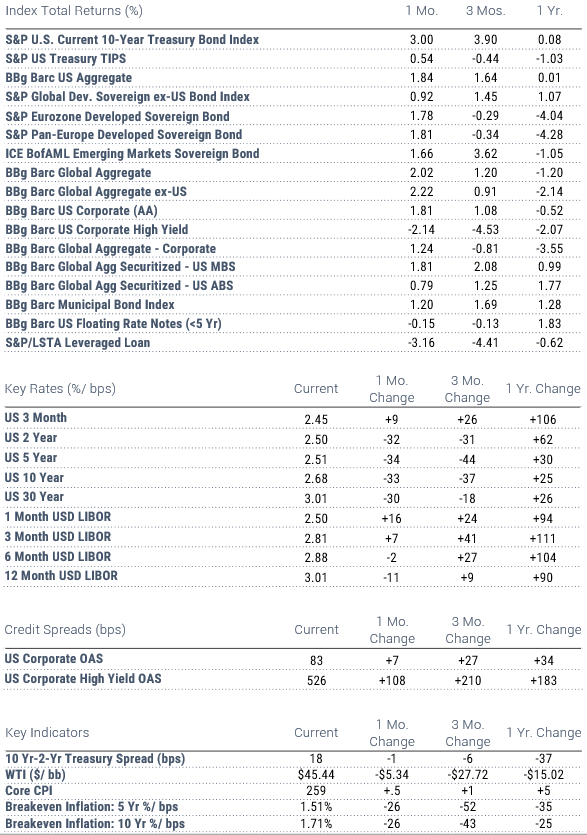
Index Returns – all shown in US dollars
All returns shown trailing 12/31/2018 for the period indicated. “YTD” refers to the total return as of prior-year end, while the other returns are annualized. 3-month and annualized returns are shown for:
- The Barclay’s US Aggregate Index, a broad based unmanaged bond index that is generally considered to be representative of the performance of the investment grade, US dollar-denominated, fixed-rate taxable bond market.
- The ICE BofAML Emerging Markets Sovereign Bond Index is a subset of The BofA Merrill Lynch World Sovereign Bond Index excluding all securities with a country of risk that is a member of the FX G10, all Western European countries, and territories of the U.S. and Western European countries. The FX G10 includes all Euro members, the U.S., Japan, the U.K., Canada, Australia, New Zealand, Switzerland, Norway, and Sweden.
- The Bloomberg Barclays Global Aggregate Index, which measures global investment grade debt from twenty-four local currency markets. This multi-currency benchmark includes treasury, government-related, corporate and securitized fixed-rate bonds from both developed and emerging markets issuers.
- The S&P Global Developed Sovereign Bond index includes local-currency denominated debt publicly issued by governments in their domestic markets.
- S&P Eurozone Developed Sovereign Bond - seeks to measure the performance of Eurozone government bonds.
- The S&P Pan-Europe Developed Sovereign Bond Index is a comprehensive, market-value-weighted index designed to track the performance of local currency-denominated securities publicly issued by Denmark, Norway, Sweden, Switzerland, the U.K. and developed countries in the Eurozone for their domestic markets.
- ICE BofAML Emerging Markets Sovereign Bond - tracks the performance of US dollar (USD) and Euro denominated emerging markets non-sovereign debt publicly issued within the major domestic and Eurobond markets.
- The Bloomberg Barclay’s US Corporate Bond Index (AA), which measures the investment grade, fixed-rate, taxable corporate bond market. It includes USD denominated securities publicly issued by US and non-US industrial, utility and financial issuers.
- The Bloomberg Barclay’s US Corporate High Yield Index, which covers the USD-denominated, non-investment grade, fixed-rate, taxable corporate bond market.
- Bloomberg Barclay’s Global Aggregate Securitized- US Mortgage-Backed Securities, which is a component of the Bloomberg Barclay’s US Aggregate Index and measures investment grade mortgage backed pass-through securities of GNMA, FNMA, and FHLMC.
- Bloomberg Barclay’s Global Aggregate Securitized- US Asset-Backed Securities, which is a component of the Bloomberg Barclay’s US Aggregate Index and includes the pass-throughs, bullets, and controlled amortization structures of only the senior class of ABS issues.
- The Blomberg Barclay’s US Floating Rate Notes (<5 Yr) Index, measures the performance of U.S dollar-dominated, investment grade floating rate notes with maturities less than 5 years.
- The Bloomberg Barclay’s Municipal Bond Index, which measures investment grade, tax-exempt bonds with a maturity of at least one year.
- The S&P/ LSTA Leveraged Loan Index is designed to reflect the performance of the largest facilities in the leveraged loan market.
Key Rates
Key Rates are shown for US Treasurys and London Interbank Offered Rate (LIBOR), the interest rate at which banks offer to lend funds (wholesale money) to one another in the international interbank market. LIBOR is a key benchmark rate that reflects how much it costs banks to borrow from each other. “Current” refers to the percentage rate as of 6/30/2018, while the rates of change are stated in basis points.
Credit Spreads
Credit Spreads shown comprise the Option-Adjusted Spread of the indices indicated, versus the US 10-Year Treasury Yield. “Current” refers to the spread as of 6/30/2018, while the rates of change are stated in basis points.
Key Indicators
Key Indicators correspond to various macro-economic and rate-related data points that we consider impactful to fixed income markets.
- 2s10s (bps)/ 10 Yr vs 2 Yr Treasury Spread, which measures the difference between yields on 10-Year Treasury Constant Maturity Securities and 2-Year Treasury Constant Maturity Securities.
- West Texas Intermediate, which is an oil benchmark and the underlying asset in the New York Mercantile Exchange’s oil futures contract.
- Core Consumer Price Index, which measures the consumer price index excluding food and energy prices. Shown as of the prior month-end.
- Breakeven Inflation: 5 Yr %/ bps, which uses 5-Year Treasury Constant Maturity Securities and 5-Year Treasury Inflation–Indexed Constant Maturity Securities to derive expected inflation.
- Breakeven Inflation: 10 Yr %/ bps, which uses 10-Year Treasury Constant Maturity Securities and 10-Year Treasury Inflation–Indexed Constant Maturity Securities to derive expected inflation.
General Disclosure
This document is intended for informational purposes only and should not be otherwise disseminated to other third parties. Past performance or results should not be taken as an indication or guarantee of future performance or results, and no representation or warranty, express or implied is made regarding future performance or results. This document does not constitute an offer to sell, or a solicitation of an offer to purchase, any security, future or other financial instrument or product. This material is proprietary and being provided on a confidential basis, and may not be reproduced, transferred or distributed in any form without prior written permission from WST. WST reserves the right at any time and without notice to change, amend, or cease publication of the information. This material has been prepared solely for informative purposes. The information contained herein includes information that has been obtained from third party sources and has not been independently verified. It is made available on an "as is" basis without warranty and does not represent the performance of any specific investment strategy.
This material is proprietary and being provided on a confidential basis, and may not be reproduced, transferred or distributed in any form without prior written permission from WST. WST reserves the right at any time and without notice to change, amend, or cease publication of the information. This material has been prepared solely for informative purposes. The information contained herein includes information that has been obtained from third party sources and has not been independently verified. It is made available on an "as is" basis without warranty and does not represent the performance of any specific investment .Some of the information enclosed may represent opinions of WST and are subject to change from time to time and do not constitute a recommendation to purchase and sale any security nor to engage in any particular investment strategy. The information contained herein has been obtained from sources believed to be reliable but cannot be guaranteed for accuracy. Past performance is not necessarily indicative of future results. Securities and services are not FDIC or any other government agency insured – Are not bank guaranteed – May lose Value.
Besides attributed information, this material is proprietary and may not be reproduced, transferred or distributed in any form without prior written permission from WST. WST reserves the right at any time and without notice to change, amend, or cease publication of the information. This material has been prepared solely for informative purposes. The information contained herein may include information that has been obtained from third party sources and has not been independently verified. It is made available on an “as is” basis without warranty. This document is intended for clients for informational purposes only and should not be otherwise disseminated to other third parties. Past performance or results should not be taken as an indication or guarantee of future performance or results, and no representation or warranty, express or implied is made regarding future performance or results. This document does not constitute an offer to sell, or a solicitation of an offer to purchase, any security, future or other financial instrument or product.