
2Q 2019 - Global Equity Markets Review
2Q was an up-and-down affair but ultimately the cavalry came for risk assets, with central banks responding to weak economic data with sweeping promises of further accommodation and monetary stimulus.
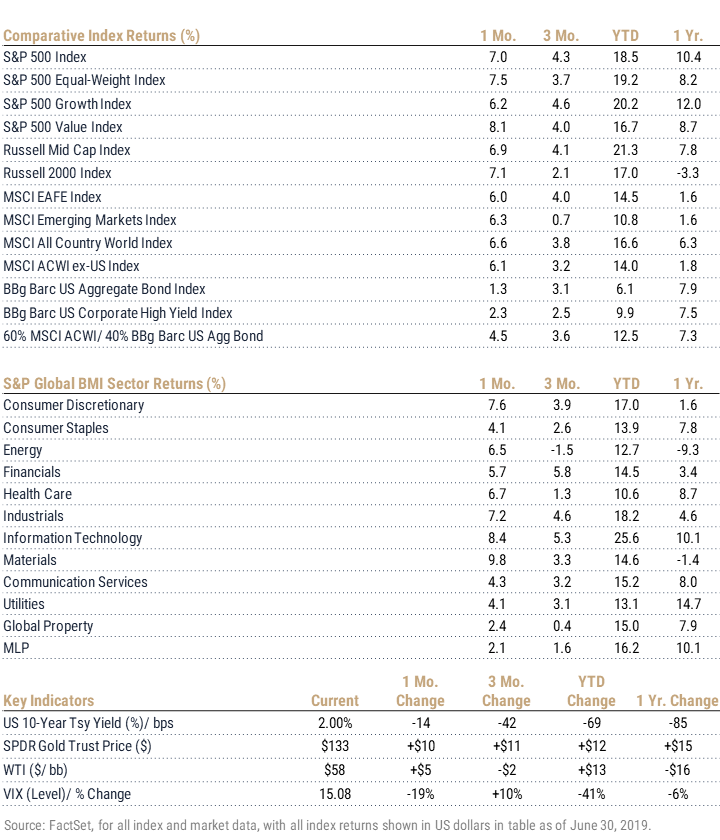
The quarter had opened positively – thanks to better-than-feared earnings and soothing tones from central banks – before US-China trade talks unraveled in May, sinking equities and rallying bond prices. Central banks were the only real story in the final weeks of the quarter; rarely have capital markets been as comprehensively positive as they were in June. There was a buyer for everything and as a result essentially all major asset classes, sectors, indices, commodities and sovereigns are firmly in the black year to date. Global stocks, as measured by the MSCI All Country World Index, in June clawed back May’s losses and then some, adding 6.6% to round out a 3.8% quarterly gain, a 16.6% year-to-date move and again of 6.3% for the trailing 12-month period.
The US underperformed developed international in May but evened the score in June (+7.0% for the S&P 500) and ultimately maintains the pole-position globally for both the quarter (+4.3%) and year-to-date period (+18.5%). The breadth of the June rally was evident in both a 50-basis point advantage to equal-weight (vs. cap-weight), and in a nearly 200-basis point advantage to the S&P 500 Value over the Growth index (+8.1% vs. 6.2% for the month).
Value does continue to lag materially over all recent periods and persists in underperforming during sell-off events.
US mid caps modestly trailed in June and for the quarter but are the year-to-date US leaders, while small caps – which suffered mightily during sell-offs in 4Q ‘18 and May ’19 – have kept up reasonably well year to date (+17.0%) but are still working back into the black for the one-year period.
The world ex-US gained 3.2% during 2Q and has advanced 14.0% in 2019 thus far. Across asset classes Europe enjoyed a particularly strong quarter, with equities modestly outperforming the US (+4.9%) and bonds posting a market-leading return as European Central Bank (ECB) president Mario Draghi made very clear the ECB’s commitment to battling economic deterioration with aggressive policy.
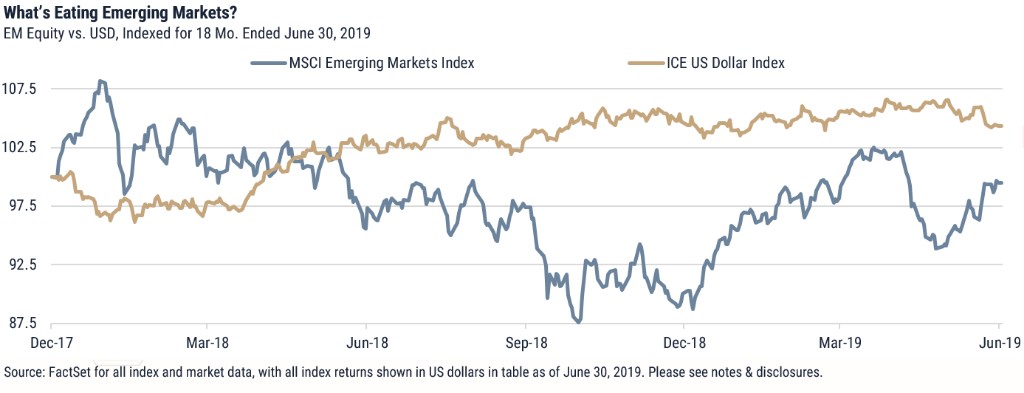
Leveraged significantly (and unfavorably for most of the last 18 months) both to dollar strength and a variety of US trade policy moves, emerging markets brought up the rear for 2Q, adding just 0.7% and settling near 800 basis points behind the S&P year to date. EM struggled to find direction even as oil prices strengthened and monetary policy continued to stack up positively. China was the primary drag, as the country’s June rally was inadequate to recover all of May’s double-digit setback, and the overall result was a quarterly loss of 3.92% for the country. US tariffs leveled at Mexico and unclear economic prospects in Brazil have slowed momentum. Global growth uncertainty and political arm-twisting by the US has stifled would-be momentum for India (the fastest-growing major economy). Given strong data and subdued inflation, the most recent budget omitted hoped-for stimulus and thus Indian stocks sat out the quarter, skipping both rallies as well as the sell-off and adding just 50 basis points overall.
Index Returns – all shown in US dollars
All returns shown trailing 6/30/2019 for the period indicated. “YTD” refers to the total return as of prior-year end, while the other returns are annualized. 3-month and annualized returns are shown for:
- The S&P 500 index is comprised of large capitalized companies across many sectors and is generally regarded as representative of US stock market and is provided in this presentation in that regard only.
- The S&P 500® Equal Weight Index (EWI) is the equal-weight version of the widely-used S&P 500. The index includes the same constituents as the capitalization weighted S&P 500, but each company in the S&P 500 EWI is allocated a fixed weight - or 0.2% of the index total at each quarterly rebalance. The S&P 500 equal-weight index (S&P 500 EWI) series imposes equal weights on the index constituents included in the S&P 500 that are classified in the respective GICS® sector.
- The S&P 500 Growth Index is comprised of equities from the S&P 500 that exhibit strong growth characteristics and is weighted by market-capitalization.
- The S&P 500 Value Index is a market-capitalization weighted index comprising of equities from the S&P 500 that exhibit strong value characteristics such as book value to price ratio, cash flow to price ratio, sales to price ratio, and dividend yield.
- The Russell 3000 Index tracks the performance of 3000 U.S. corporations, determined by market-capitalization, and represents 98% of the investable equity market in the United States.
- The Russell Mid Cap Index measures the mid-cap segment performance of the U.S. equity market and is comprised of approximately 800 of the smallest securities based on current index membership and their market capitalization.
- The Russell Micro Cap Index is a market-capitalization weighted index that measures the performance of 2000 small-cap and mid-cap securities. The index was formulated to give investors an unbiased collection of the smallest tradable equities still meeting exchange listing requirements.
- The MSCI All Country World Index provides a measure of performance for the equity market throughout the world and is a free float-adjusted market capitalization weighted index.
- The MSCI EAFE Index is a market-capitalization weighted index and tracks the performance of small to large-cap equities in developed markets of Europe, Australasia, and the Far East.
- The MSCI Emerging Markets Index is a float-adjusted market-capitalization index that measures equity market performance in global emerging markets and cannot be purchased directly by investors.
- The S&P Global BMI sector indices are into sectors as defined by the widely used Global Industry Classification Standards (GICS) classifications. Each sector index comprises those companies included in the S&P Global BMI that are classified as members of respective GICS® sector. The S&P Global BMI Indices were introduced to provide a comprehensive benchmarking system for global equity investors. The S&P Global BMI is comprised of the S&P Emerging BMI and the S&P Developed BMI. It covers approximately 10,000 companies in 46 countries. To be considered for inclusion in the index, all listed stocks within the constituent country must have a float market capitalization of at least $100 million. For a country to be admitted, it must be politically stable and have legal property rights and procedures, among other criteria.
- The Barclay’s US Aggregate Index, a broad based unmanaged bond index that is generally considered to be representative of the performance of the investment grade, US dollar-denominated, fixed-rate taxable bond market.
- The Bloomberg Barclay’s US Corporate High Yield Index, which covers the USD-denominated, non-investment grade, fixed-rate, taxable corporate bond market.
Key Indicators
Key Indicators correspond to various macro-economic and rate-related data points that we consider impactful to equity markets.
- The US 10-Year Treasury Yield (%)/bps, is the return on investment for the U.S. government’s 10-year debt obligation and serves as a signal for investor confidence.
- SPDR Gold Trust Price ($), is an investment fund that reflects the performance on the price of a gold bullion, less the Trust’s expenses.
- West Texas Intermediate, which is an oil benchmark and the underlying asset in the New York Mercantile Exchange’s oil futures contract.
- CBOE Volatility Index (Level)/% Change, which uses price options on the S&P 500 to estimate the market's expectation of 30-day volatility.
This document is intended for informational purposes only and should not be otherwise disseminated to other third parties. Past performance or results should not be taken as an indication or guarantee of future performance or results, and no representation or warranty, express or implied is made regarding future performance or results. This document does not constitute an offer to sell, or a solicitation of an offer to purchase, any security, future or other financial instrument or product. This material is proprietary and being provided on a confidential basis, and may not be reproduced, transferred or distributed in any form without prior written permission from WST. WST reserves the right at any time and without notice to change, amend, or cease publication of the information. This material has been prepared solely for informative purposes. The information contained herein includes information that has been obtained from third party sources and has not been independently verified. It is made available on an "as is" basis without warranty and does not represent the performance of any specific investment strategy.
We consider an index to be a portfolio of securities whose composition and proportions are derived from a rules-based model. See the appropriate disclosures regarding models, indices and the related performance. You cannot invest directly in an index and the performance of an index does not represent the performance of any specific investment. Some of the information enclosed may represent opinions of WST and are subject to change from time to time and do not constitute a recommendation to purchase and sale any security nor to engage in any particular investment strategy.
Past performance or results should not be taken as an indication or guarantee of future performance or results, and no representation or warranty, express or implied is made regarding future performance or results.
Besides attributed information, this material is proprietary and may not be reproduced, transferred or distributed in any form without prior written permission from WST. WST reserves the right at any time and without notice to change, amend, or cease publication of the information. This material has been prepared solely for informative purposes. The information contained herein may include information that has been obtained from third party sources and has not been independently verified. It is made available on an “as is” basis without warranty. This document is intended for clients for informational purposes only and should not be otherwise disseminated to other third parties. Past performance or results should not be taken as an indication or guarantee of future performance or results, and no representation or warranty, express or implied is made regarding future performance or results. This document does not constitute an offer to sell, or a solicitation of an offer to purchase, any security, future or other financial instrument or product.