
July 2019 - Global Equity Markets Review
July saw global equity markets move to the positive overall, but not without balking late in the month ahead of the Fed enacting an interest rate cut (25 basis points) for the first time in 11 years. The European Central Bank (ECB), meanwhile, continued to signal high near-term probability of stimulus measures while, as anticipated, nominating notable dove Christine Lagarde to assume leadership in November. With little else to consider given an unchanged US/ China outlook and a relatively uneventful (even if busy) month in European politics, global stocks, as measured by the MSCI ACWI, saw mixed results but ultimately topped off a 17% year-to-date return with a 0.3% move for the month. Intermittent retreats aside, it was a lukewarm but positive result propped up by the same core factors and assurances that have carried markets through the last couple of quarters: soothing central bank tones, better-than-feared economic and earnings data and constructive headline movement that seems to dose confidence at critical times.
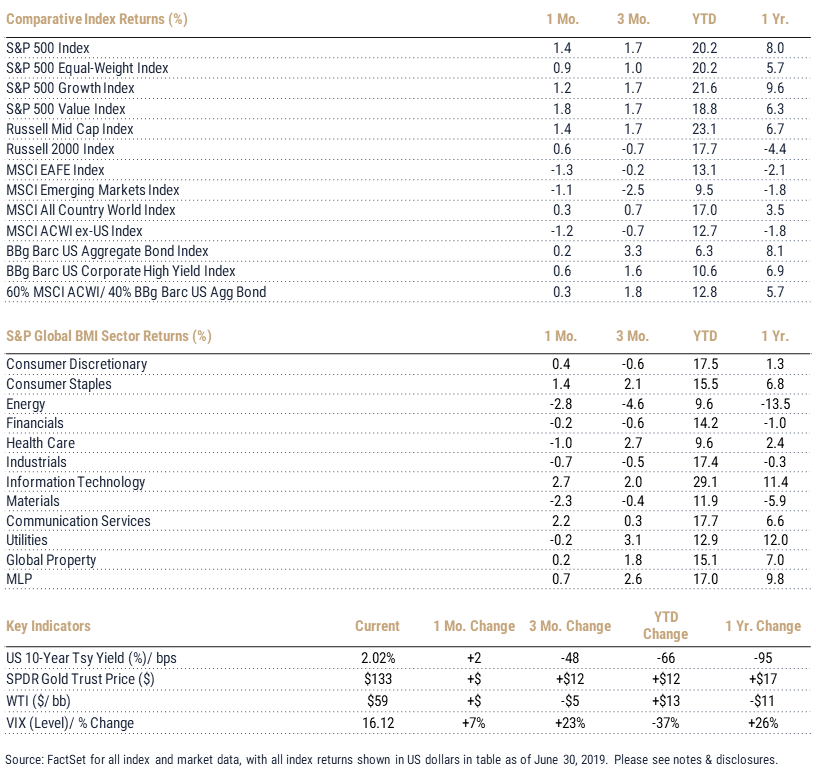
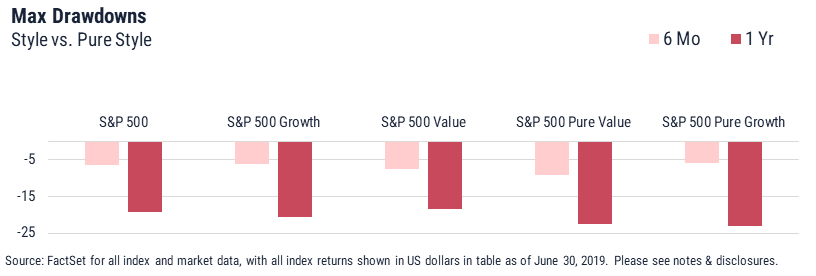
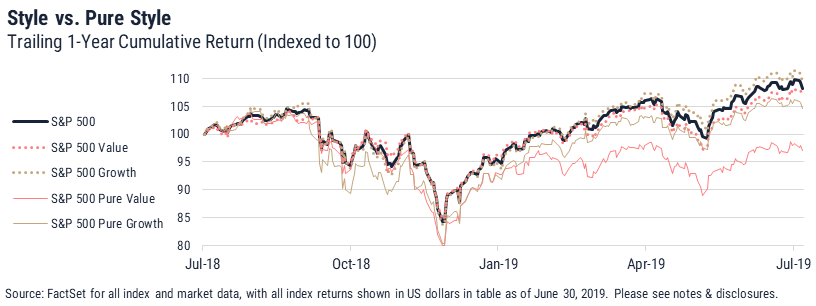
US equities – up 1.4% as measured by the S&P 500 – led globally and were buoyed by a stronger-than-expected start to earnings season, as ¾ of S&P companies reporting in July beat expectations (which were fairly low given manifold pressures on the growth outlook). Large cap value (+1.8%), as measured by the S&P 500 Value index, topped growth (+1.2%). It is worth nothing that the value index holds Apple, which returned 8% and drove a third of index net-positive return (roughly the differential vs. the growth index). The stock drove roughly 20% of the core S&P 500 Index return. Pressure persists on value companies, however, and as shown in the below charts (which compare the S&P 500 Value vs. the S&P Pure Value and the S&P 500 Growth vs. S&P 500 Pure Growth), the “core” end of the characteristic spectrum appears to have blunted the impacts of more strictly defined style characteristics. That is, the traditional value index has held up substantially better than its “pure” counterpart, which has been punished as the market rejects the value factor in favor of higher-quality and growthier names. Pure growth has lagged core-growth (due mainly to the Communication Services underweight) but not so drastically as seen in value.
Equal-weight (+0.9%) underperformed market-weight, reflecting underweights in Technology and Communication Services and in general the outperformance of larger names across sectors. Year-to-date performance (+20.2%) is exactly on par with the market-weight S&P 500, however, reflecting some breadth in market movement. Interestingly, however, while equal-weight lagged mid caps (up 1.4% as measured by the Russell Mid Cap Index) matched the S&P return and added to a market-leading 23.1% year-to-date return. While – as with US equities overall – mid-cap performance has been most significantly leveraged to Technology, mid-cap Financials and Industrials have been stand-outs from a performance perspective.
Developed ex-US stocks overall shed 1.3% in US dollar terms but rose modestly in local currency. Dollar strengthening was a setback for stocks outside the US, compounding losses in countries such as Germany and Korea and erasing would-be gains for the United Kingdom and Japan. For now, investors appear to take the path of least resistance, with an eye toward eventual fruits of monetary policy and political change. Emerging markets continued to struggle on an absolute and relative basis, shedding 1.1% as India and Mexico sold off. China shed just 50 basis points as investors digested stabilizing – if tepid - consumer and manufacturing data.
Notes and Disclosures
Index Returns – all shown in US dollars
All returns shown trailing 7/31/2019 for the period indicated. “YTD” refers to the total return as of prior-year end, while the other returns are annualized. 3-month and annualized returns are shown for:
- The S&P 500 index is comprised of large capitalized companies across many sectors and is generally regarded as representative of US stock market and is provided in this presentation in that regard only.
- The S&P 500® Equal Weight Index (EWI) is the equal-weight version of the widely-used S&P 500. The index includes the same constituents as the capitalization weighted S&P 500, but each company in the S&P 500 EWI is allocated a fixed weight - or 0.2% of the index total at each quarterly rebalance. The S&P 500 equal-weight index (S&P 500 EWI) series imposes equal weights on the index constituents included in the S&P 500 that are classified in the respective GICS® sector.
- The S&P 500 Growth Index is comprised of equities from the S&P 500 that exhibit strong growth characteristics and is weighted by market-capitalization.
- The S&P 500 Value Index is a market-capitalization weighted index comprising of equities from the S&P 500 that exhibit strong value characteristics such as book value to price ratio, cash flow to price ratio, sales to price ratio, and dividend yield.
- The Russell 3000 Index tracks the performance of 3000 U.S. corporations, determined by market-capitalization, and represents 98% of the investable equity market in the United States.
- The Russell Mid Cap Index measures the mid-cap segment performance of the U.S. equity market and is comprised of approximately 800 of the smallest securities based on current index membership and their market capitalization.
- The Russell Micro Cap Index is a market-capitalization weighted index that measures the performance of 2000 small-cap and mid-cap securities. The index was formulated to give investors an unbiased collection of the smallest tradable equities still meeting exchange listing requirements.
- The MSCI All Country World Index provides a measure of performance for the equity market throughout the world and is a free float-adjusted market capitalization weighted index.
- The MSCI EAFE Index is a market-capitalization weighted index and tracks the performance of small to large-cap equities in developed markets of Europe, Australasia, and the Far East.
- The MSCI Emerging Markets Index is a float-adjusted market-capitalization index that measures equity market performance in global emerging markets and cannot be purchased directly by investors.
- The S&P Global BMI sector indices are into sectors as defined by the widely used Global Industry Classification Standards (GICS) classifications. Each sector index comprises those companies included in the S&P Global BMI that are classified as members of respective GICS® sector. The S&P Global BMI Indices were introduced to provide a comprehensive benchmarking system for global equity investors. The S&P Global BMI is comprised of the S&P Emerging BMI and the S&P Developed BMI. It covers approximately 10,000 companies in 46 countries. To be considered for inclusion in the index, all listed stocks within the constituent country must have a float market capitalization of at least $100 million. For a country to be admitted, it must be politically stable and have legal property rights and procedures, among other criteria.
- The Barclay’s US Aggregate Index, a broad based unmanaged bond index that is generally considered to be representative of the performance of the investment grade, US dollar-denominated, fixed-rate taxable bond market.
- The Bloomberg Barclay’s US Corporate High Yield Index, which covers the USD-denominated, non-investment grade, fixed-rate, taxable corporate bond market.
Key Indicators
Key Indicators correspond to various macro-economic and rate-related data points that we consider impactful to equity markets.
- The US 10-Year Treasury Yield (%)/bps, is the return on investment for the U.S. government’s 10-year debt obligation and serves as a signal for investor confidence.
- SPDR Gold Trust Price ($), is an investment fund that reflects the performance on the price of a gold bullion, less the Trust’s expenses.
- West Texas Intermediate, which is an oil benchmark and the underlying asset in the New York Mercantile Exchange’s oil futures contract.
- CBOE Volatility Index (Level)/% Change, which uses price options on the S&P 500 to estimate the market's expectation of 30-day volatility.
This document is intended for informational purposes only and should not be otherwise disseminated to other third parties. Past performance or results should not be taken as an indication or guarantee of future performance or results, and no representation or warranty, express or implied is made regarding future performance or results. This document does not constitute an offer to sell, or a solicitation of an offer to purchase, any security, future or other financial instrument or product. This material is proprietary and being provided on a confidential basis, and may not be reproduced, transferred or distributed in any form without prior written permission from WST. WST reserves the right at any time and without notice to change, amend, or cease publication of the information. This material has been prepared solely for informative purposes. The information contained herein includes information that has been obtained from third party sources and has not been independently verified. It is made available on an "as is" basis without warranty and does not represent the performance of any specific investment strategy.
We consider an index to be a portfolio of securities whose composition and proportions are derived from a rules-based model. See the appropriate disclosures regarding models, indices and the related performance. You cannot invest directly in an index and the performance of an index does not represent the performance of any specific investment. Some of the information enclosed may represent opinions of WST and are subject to change from time to time and do not constitute a recommendation to purchase and sale any security nor to engage in any particular investment strategy.
Past performance or results should not be taken as an indication or guarantee of future performance or results, and no representation or warranty, express or implied is made regarding future performance or results.
Besides attributed information, this material is proprietary and may not be reproduced, transferred or distributed in any form without prior written permission from WST. WST reserves the right at any time and without notice to change, amend, or cease publication of the information. This material has been prepared solely for informative purposes. The information contained herein may include information that has been obtained from third party sources and has not been independently verified. It is made available on an “as is” basis without warranty. This document is intended for clients for informational purposes only and should not be otherwise disseminated to other third parties. Past performance or results should not be taken as an indication or guarantee of future performance or results, and no representation or warranty, express or implied is made regarding future performance or results. This document does not constitute an offer to sell, or a solicitation of an offer to purchase, any security, future or other financial instrument or product.