
Trying to Reason with Hurricane (and Earnings) Season
 The Atlantic hurricane season lasts for six months, approximately from early to June to late November, with a peak in activity each year around mid-September. We are less than halfway through the current season; East Coast residents remain vigilant of storm activity the African continent spits into the Atlantic.
Equity investors, too, have a watchful season. Quarterly results often cause individual stock activity to separate - at least in the short run - from overall market trends. Broad patterns may emerge among economic sectors, providing clues to the overall health of the economy just as the hurricane trackers do when predicting a storm’s path. We are now halfway through the reporting period for second quarter sales and earnings among US public companies. What fundamental trends in the first half of 2017 might suggest about the remainder of the year, and into 2018, is the subject of this letter.
The eye of the hurricane is aptly described in the above quote. Once the front edge of the hurricane passes the rain stops, the sun briefly reappears and birds caught in the storm patiently wait for an opportunity for escape to calmer weather. A typical eye diameter is 20 miles, but can be as large as 40 miles.
We have written in the recent past about the unusual calm in the U.S. stock market. The chart below illustrates the annualized standard deviation of weekly returns in the S&P 500, which is a useful proxy for market risk. We are currently bouncing along at 40 year lows in market volatility which naturally prompts the question of whether investors in stocks have become too complacent. The contrary gene in us tends to concur about investor sentiment. However, corporate sales and earnings are the foundation of market support and here the news suggests an eventual rise in market volatility says nothing about when the reversion to the mean begins.
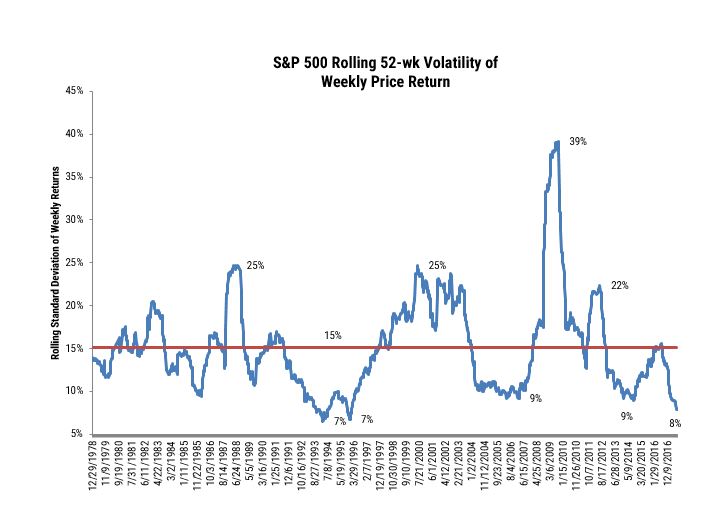 Source: FactSet, from January 1978-July 2017.
The second chart below illustrates a comparison between what Wall Street analysts expected at the mid-point of the quarter and what actually transpired for a wide universe of publicly held U.S. companies. Readings above 50% indicate analysts were too pessimistic in their forecasts in sales and earnings per share. Rising expectations of sales and earnings suggest the fundamental case for investor optimism is rational. A case can be made the price return in the broad market this year has been entirely supported by the growth of underlying fundamentals as valuation remained stable since the beginning of 2017.
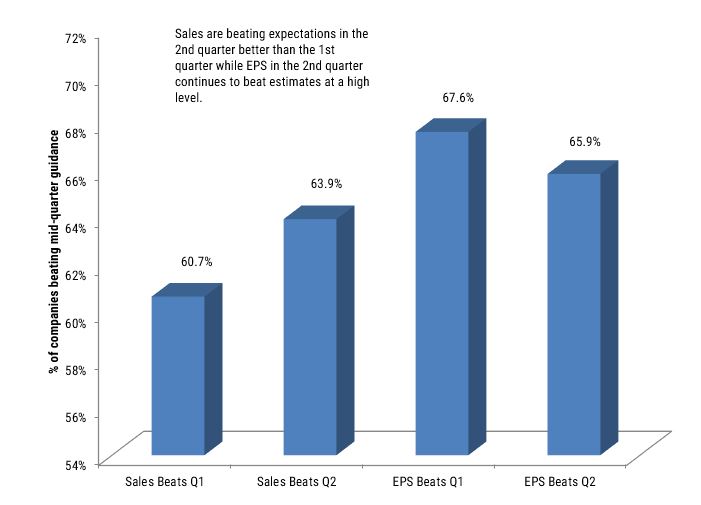 Source: FactSet referencing 2017 earnings data through August 2017.
I will suggest human nature at times can be as unpredictable as the direction of a hurricane’s path. What we do know as a fact is there will be a back half of the storm where we now stand in its calm center. The strong wind and rain will blow again as increasingly difficult comparisons for sales and earnings are inevitable. Investor reaction to a natural slowing of momentum will be a critical trend to monitor. We concede an acceleration of global economic activity can keep growth supportive of current valuations. Nevertheless, the skeptic in us would note corporate profit margins are already at multi-cycle highs and further positive surprises in fundamentals driving higher stock valuations is diminishing with time.
The best time to buy plywood for protecting windows and doors from damaging wind and rain is when the sun is still out. Waiting until the insanity of the crowd shows up before your trip to the hardware store will bring long lines and empty shelves.

Besides attributed information, this material is proprietary and may not be reproduced, transferred or distributed in any form without prior written permission from WST. WST reserves the right at any time and without notice to change, amend, or cease publication of the information. This material has been prepared solely for informative purposes. The information contained herein may include information that has been obtained from third party sources and has not been independently verified. It is made available on an “as is” basis without warranty. This document is intended for clients for informational purposes only and should not be otherwise disseminated to other third parties. Past performance or results should not be taken as an indication or guarantee of future performance or results, and no representation or warranty, express or implied is made regarding future performance or results. This document does not constitute an offer to sell, or a solicitation of an offer to purchase, any security, future or other financial instrument or product.