
WST Commentary: 4Q 2019 Markets & Economic Update
"I have often had to eat my words, and I must confess that I have always found it a wholesome diet.” -Winston Churchill
Investors wrapped the year - and indeed the decade - with a risk-on flourish that in our view conveyed equal parts relief and optimism: relief in what did not go wrong in 2019 and optimism around what may go right in 2020. Both perspectives are rooted in the swift actions throughout the year of central banks and fiscal policymakers to course-correct global fundamentals through coordinated monetary easing and fiscal stimulus.
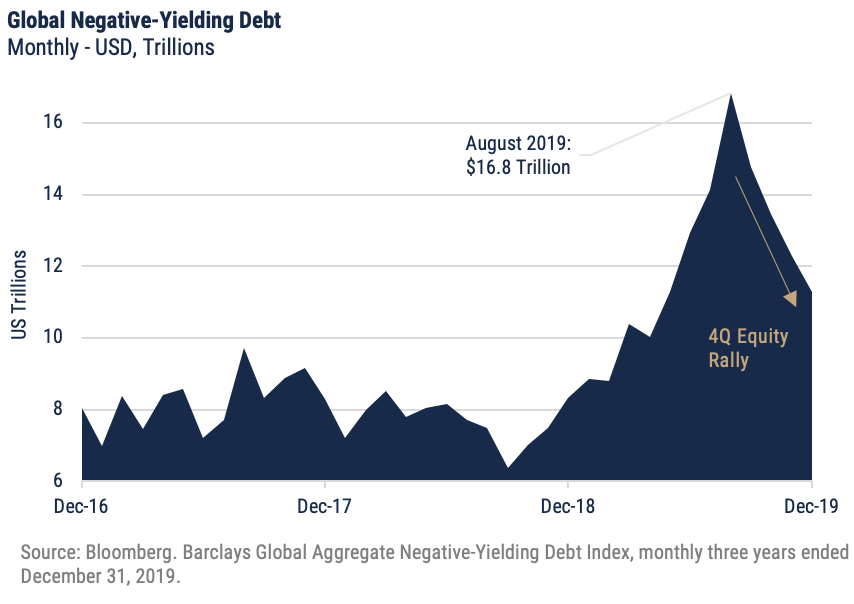
The quarter saw key stock indices tack on anywhere from 7% to 12%, ending the technical ping-pong match in play throughout most of 2019 and ultimately delivering a stellar year for global shares and hinting that long-disfavored styles and segments (value, European and emerging markets equities) may finally get their time in the sun. After a robust bond rally throughout most of 2019, core yields rose as risk appetite boldened, quelling the end-of-days rates-market mood that drove one of the more important phenomena (and splashier market headlines) in 2019: the ballooning share of global negative-yielding debt. Credit and riskier income assets continued to drift upward, ending the year up double digits.
As we’ll discuss in the asset class reviews there were few losers in capital markets during 4Q and none during the full-year period, although there were clear favorites. Albeit present and visible during a handful of trading sessions, volatility (as measured by the VIX, or so-called “Fear Index”) was steady throughout the quarter and modest in comparison to the rest of 2019, ending at roughly half the level observed at the end of last year.
Even if all is well that ends in double-digit returns, we believe it is worthwhile to understand 2019 as a unique interaction between policy and macro maneuvers, fundamental expectations, market structure and participant behavior. Markets ran on a shoe-string confidence budget that rested almost entirely on the actions of the Fed and its peers – all eggs in one basket. It was, all said, a very crooked path to the S&P 500’s banner return of 31.5%, beginning with the stage-setting equity fire sale in late 2018.
In the 1st and 2nd quarters investors weighed sour trade and political tones against the global uptake of a Fed-led easing agenda. The 2nd quarter shored up equity returns while lighting the burners under a bond-buying spree that lasted deep into the year, roughly doubling the global footprint of negative-yielding debt (as shown above, from $8.8 trillion in February to $16.8 trillion in August).
Stocks and bonds alike bobbed along until August, when equity markets capitulated to escalating trade headlines and a continued slide in global economic data. That month marked the peak of the bond rally, however, as renewed risk appetite dealt a technical correction to global yields and set the stage for fresh highs in equity. 4Q saw the Fed cut rates for a third time while signaling a pause in that agenda; it also saw the year’s monetary and fiscal maneuvers rewarded with a modest rally in global economic data, while corporate performance brightened as it digested the impacts of rate cuts that began early in the year. Equity bulls had seen enough and were off to the races.
While relief is fair and optimism reasonable, we emphasize that the economy is not the stock market; a better-defined economic backdrop does not simplify the investment landscape. We believe that the intermediate-term rates paradigm (at least in terms of accommodation) is well-established at this stage and mostly baked into core asset prices. Investors thus enter this year with a higher-conviction macro outlook but also without the upside potential that drove 2019, and with waning structural support that justified much of the multiple expansion in US stocks especially (incrementally declining rates, a strengthening dollar, continued benefits from tax reform).
Did we mention it’s also an election year in the US? Meanwhile, the bond market going forward may have less to do with the economy than it has historically and may be tightly range-bound given the path for policy rates combined with important demand dynamics among capital markets participants. All said, 2020 offers an appealing economic backdrop but a complex investment puzzle that demands a balance of flexible thinking and a long-term view.
Economic Recap
Two themes in 4Q 2019 served to erode global recession risk and rally an embattled economic outlook. First, short-term leading indicators finally evidenced a year’s worth of coordinated monetary easing and aggressive stimulus in key economies. Second, there occurred market-friendly progress in both US-China Trade negotiations and Brexit discussions, providing a second pillar to a thesis for recovery and a return to above-trend growth in 2020.
Throughout 2019 the US macro outlook was a day-to-day wash between strong financial conditions and a manufacturing economy completely at the mercy of the US-China trade conflict. The US was nonetheless viewed as the ballast globally and best-positioned among major developed economies given solid employment, a bullish (if slightly weary) consumer, strong dollar, stable services growth and corporations flush thanks to 2018 tax reform. Paramount to this privileged position has been the comparatively ample runway for the Fed to ease further should there persist an outright contractionary trend in manufacturing activity – like that observed in late 3Q – or, perhaps more critically, any clear pressure on the all-important consumer. Low inflation and the absence of clear catalysts further supported the pause-or-cut case for potential Fed action.
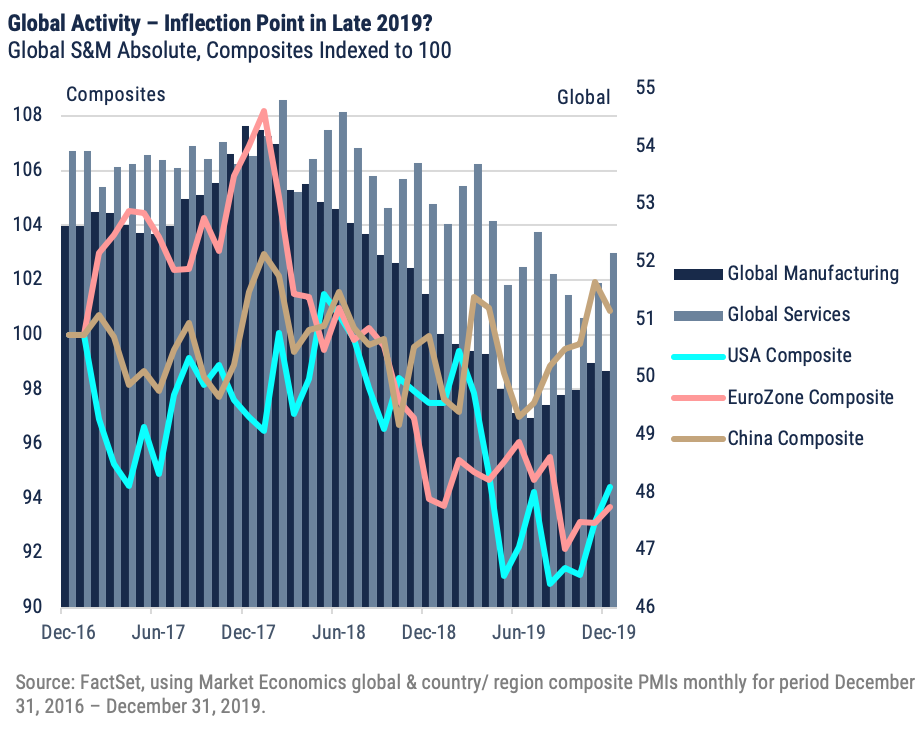
By 4Q these factors had come to roost to the upside for the US economy. Easy financial conditions appear to have primed a reset in the credit cycle and loosened the knot in terms of capital expenditure, as activity picked up in both manufacturing and services Purchasing Managers’ Indices (PMIs). Housing starts outpaced expectations, in November charting a 14% increase versus starts in the rising-rate environment a year prior; residential investment bounced back after six straight quarters of contraction.
Consumer confidence – which remains high but had begun to retreat in late summer – leveled off, while unemployment hit a 50-year low and wage growth tracked a solid 3.9%. Market reaction in March to initial yield curve inversion was telling in that it was, if anything, anti-climactic – at least relative to headlines tolling the bell for the US economic expansion. By October, when the yield curve was restored to “normal” position and began to steepen, the prospect of near-term recession appeared fully written-off by the Fed, economists and investors alike.
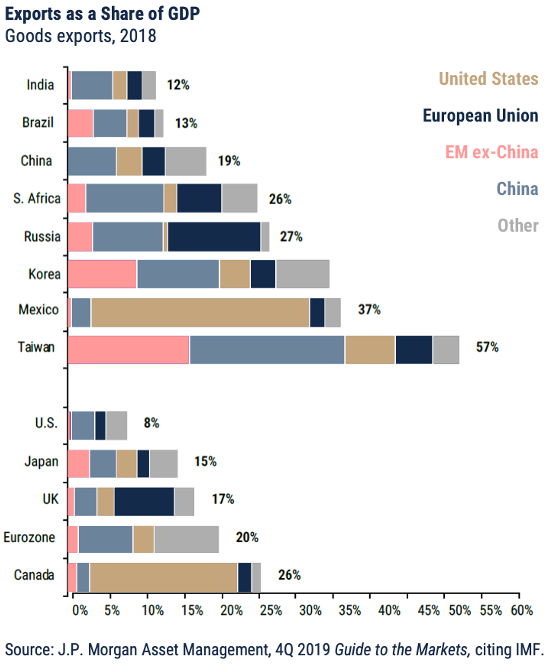
Outside the US and in Europe especially, recession loomed much nearer in 2019; Germany and Italy entered 4Q on the brink of recession, while the continued Brexit rigmarole exacerbated already cloudy business conditions and drove consecutive quarters of contraction for the UK economy. The growth outlook for China continued to dim while export-focused Asian countries suffered from escalating tariffs. India – an economy that 18 months ago was solidly outpacing China – saw its GDP growth rate slip quarter after quarter, falling from 8% in June 2018 to just 4.5% today. Other key US trade partners, such as Mexico, remained indirectly hostage to the trade debacle thanks to the chilling effect on activity overall.
Finally, however, there emerged reasonably solid evidence of (an either occurring or imminent) bottoming in international fundamentals, notably among Europe’s poorest performers. The Eurozone composite PMI – which incorporates both manufacturing and service sector activity – had charted a steep decline off its cyclical peak in January 2018, shedding nearly 20% before 4Q saw consecutive months of modest pickup on top of still-solid employment numbers and, of course, easy monetary conditions. While growth conditions remain tentative, China showed signs of stabilization on top of continued consumer and service sector growth, thanks to aggressive, targeted stimulus and easy consumer-focused credit conditions intended to offset the drag of the trade war. India’s business surveys came ripping back in the final months of the year. Overall, as with the US, key economies began to stir thanks to the lagged impacts of a roughly 100-basis point down-shift in global interest rates over the last year.
With the US resilient, Europe strengthening, China back on the rails and high-growth emerging economies in solid shape with plenty of room to ease, the stage was set for a truly sanguine turn in outlook pending progress in two key areas: US-China trade and Brexit. If monetary policy provided the short-term economic floor, investors read “rebound” in political progress and the apparent commitment towards a better-case economic scenario that we discussed in last quarter’s letter:
Under what Robeco calls the “Reboot of Globalization” scenario, the trade situation stabilizes and politicians negotiate a détente that averts the worst-case outcomes for the global economy.
The Reboot wheels, it seems, began to turn in earnest during 4Q. An improving tone in US-China trade negotiations culminated with the announcement in mid-October of a Phase One trade deal, coupled with good-faith, bilateral scrapping of tariff increases planned for that month and December. Phase One, which was signed on January 15, involves an initial tariff rollback on the basis of, basically, better behavior by China in the view of the US. Better behavior includes stronger intellectual property protections and a reduction in nontariff barriers to imports of agricultural and biotechnology products (further to that point, China evidently plans a substantial immediate purchase of US agricultural products in effort to double such imports over the next two years). The US is expected to leverage the remaining 25% tariffs in Phase Two negotiations later this year.
Equity Market Review & Outlook
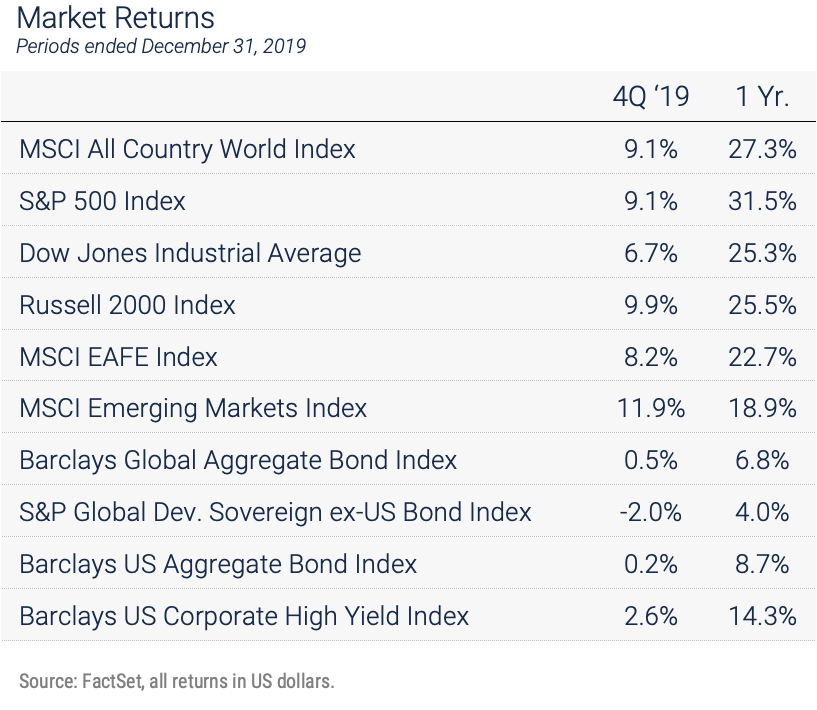
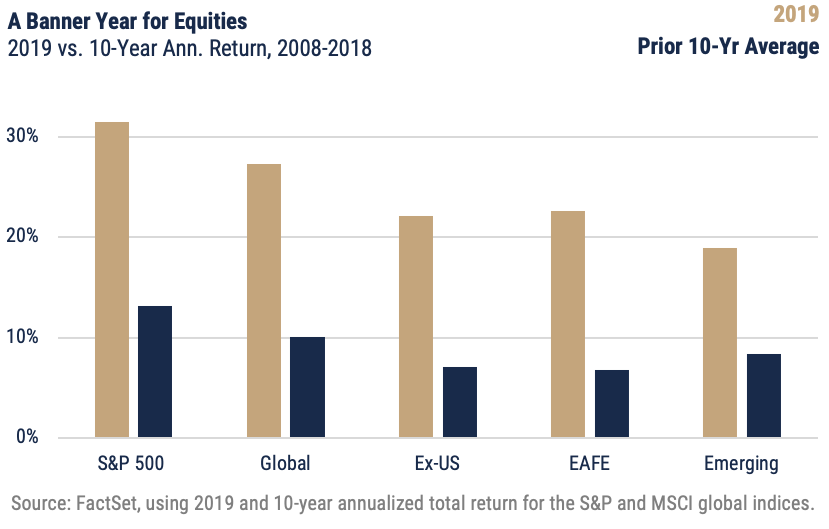
Straight path or not, it was a stellar year indeed for stocks. Global equities, as measured by the MSCI ACWI, added 9.1% for the quarter, finishing the year up 27.3%. The S&P 500 also added 9.1% for the quarter, advancing 31.5% for the year; US mid-caps lagged (+7.1%) for the period but added 30.5% during the year, while small caps enjoyed a modest advantage in 4Q (+9.9%) but underperformed the S&P 500 by a full 600 basis points for the trailing twelve months. Consistent with the advantage to larger names in 4Q, the S&P 500 Equal-Weight Index was up just 7.6%, ending the year up 29.2%.
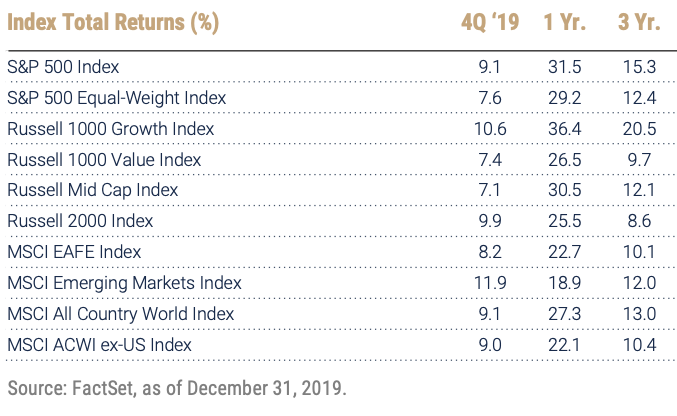
Global sectors were uniformly positive during the quarter and year. Technology market leadership – for both 4Q and 2019 overall – reflected the heavy footprint of US tech companies, which were up over 14% for the quarter and a remarkable 50% for the year; it was a US-centric story also in Health Care, the quarter’s second-best performer. Sectors where US share is smaller, at around 50% or less – Energy, Industrials, Utilities, Consumer Staples, Materials – saw positive returns driven by value’s rebound and improvement in the outlook for pro-cyclical companies. International equities posted a return of 9.0% for the quarter (+22.1% for the year), with currency impacts providing a roughly 250-basis point boost in 4Q and roughly 100 basis points in support for the year.
After a solid 2018, emerging markets spent 2019 at the mercy of US-China trade headlines and a stubborn US dollar. Guided by positive movement on US-China trade, a brighter global economic outlook and the related lift to non-USD currencies, investors dove back in during 4Q and delivered a market-leading return of 11.9% (+9.63% local). Unsurprisingly given the improvement in trade headlines there were robust bounces in mainland China and key export-heavy Asian economies. There were big winners outside the trade theme; Brazil, Russia and South Africa posted high-teens returns on rising oil prices and currency recovery.
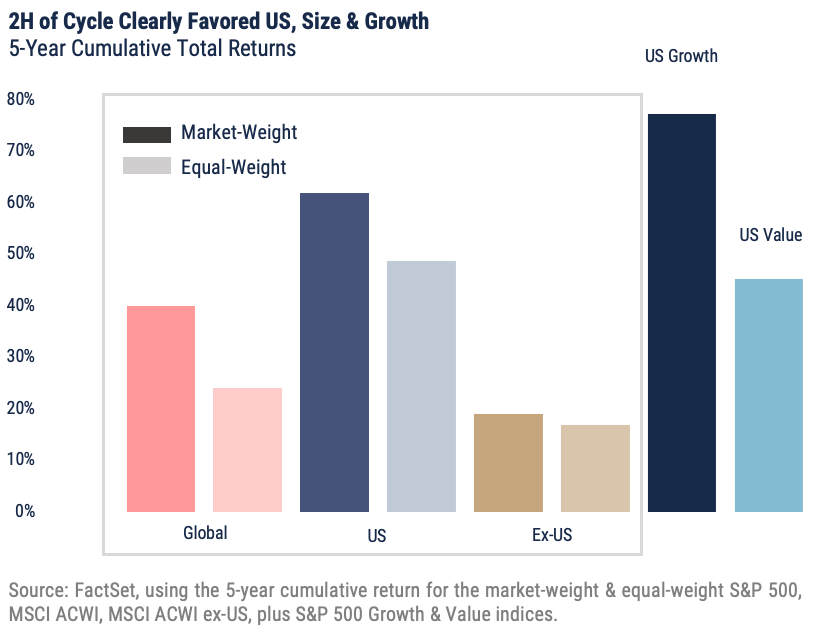
Stepping back from the stellar headline number, the fits-and-starts dynamic of 2018 and 2019 can be understood as a short-term bear environment or pause in the current cycle – the third such pause since the current run began in 2009. With the “low-and-slow” expansion, markets have been periodically susceptible to nerves around receding growth and inflation expectations, but rock-bottom rates have carried corporate performance despite those trends. We enter 2020 with a baseline assumption that both interest rates and growth are at an inflection point.
While a fair share of the year’s return was a relief rally off the 2018 fire-sale, 2019’s second act in equity may be more instructive as to likely drivers and potential opportunities in 2020, relative to the inflection point idea. P/E multiples, overall, are likely to remain elevated given continued low interest rates but – globally and especially in the US – growth companies may need to compete harder for investor attention than they have in the recent past. What seems evident, now ten years into the current bull market, is that policy regimes post-Global Financial Crisis essentially institutionalized winners and losers from an investment perspective, as easy money conditions floated a prolonged expansion while shoring up the consumer and, overall, serving to super-charge high-P/E companies through “free money” for growth through capital investment, M&A and buybacks.
Meanwhile, that same regime served to sustain significant headwinds to rate-sensitive or commodity-exposed (i.e., inflation-sensitive) firms. With little runway (or argument, currently) for continued easing, we are likely approaching the limits of that support from a pure math perspective. Globally the stage may be set for a renewed interest in well-run companies with durable or differentiated business concepts and corporate outlooks that hinge on themes such as reflation and commodity price recovery and exposure to the globally re-integrating economy. There appears to be widespread agreement in the potential for a major pro-cyclical rally among global stocks. Further, the drivers of upside are reasonably well-diversified; Europe is mostly a recovery story, while the US is expected to grow off housing and consumers. Emerging markets are leveraged to the output potential of an expanding, increasingly wealthy and better-educated middle class. Dollar-weakening is sure to ignite short-term upside in emerging markets but will support a stronger long-term arc for corporate performance in EM.
Risks abound, of course. Global economic recovery may fall short, especially should trade or Brexit negotiations disappoint. In the US, election uncertainty seems likely to drive significant volatility (and actual risk) in policy-sensitive sectors such Technology and Health Care. Should investors lose interest in the nascent factor rotation (from low-volatility to momentum and value), “cheap” assets – absent a fundamental backstop – will quickly look like traps.
Fixed Income Review & Outlook
With the global “risk-on” switch engaged by the spate of economic good news discussed above, 4Q pumped the brakes on the major rates-market rally of 2019. Still it was a positive quarter and very strong year for bond markets; the Bloomberg Barclays Global Aggregate Bond Index added 49 basis points during the quarter, wrapping the year with a total return of 6.81%.
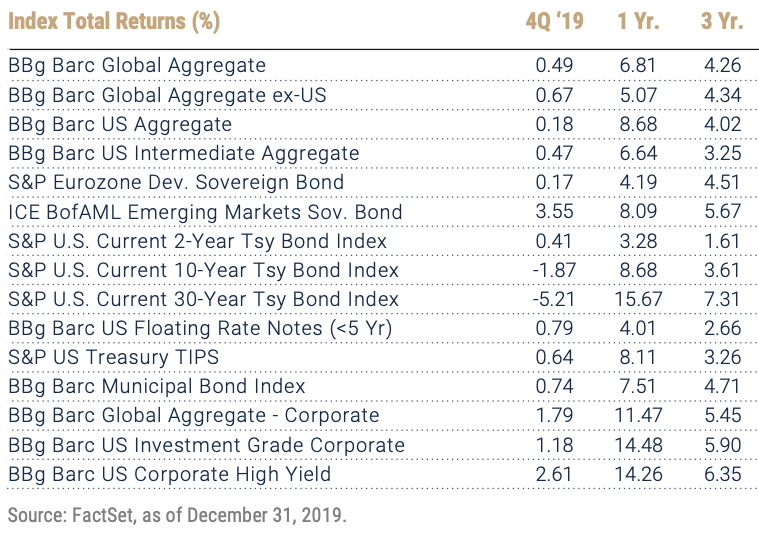
The retreat in US Treasuries deflated the US bond rally and occurred basically through two shifts in market dynamic. First, in November, weighing further cuts against positive economic news, Fed Chair Powell characterized current monetary policy as “likely to remain appropriate,” leading bond markets to reprice based on expectations of just one additional cut in 2020. Having edged in October into “normal position” as measured by the 10s2s, the yield curve shifted up slightly but flattened overall during November. In December, however, continued runoff (mostly a function of a pro-risk shift thanks to mounting positives in the outlook for equities and riskier credit) was sufficient to shift up and steepen the curve. The 10s2s – which during 2019 was, briefly and modestly, negative for the first time since 2007 – ended the quarter at 35 basis points, roughly a quarter of its 40-year average. Retracement further out on the curve set back US aggregate bond performance, which shook out at just 18 basis points on the quarter (thanks largely to a continued drift up in corporates and securitized sectors). The index finished the year up a solid 8.68%, however; even after 4Q’s technical correction the 30-year still rallied 15.67% during 2019, while the 10-year was up 8.68%. Investment-grade corporates – roughly a quarter of the index – saw momentum lost in the highest-quality issues during 4Q but overall contributed generously to US market results, posting total returns of 1.18% in 4Q and 14.48% for 2019.
Outside the US, developed sovereigns (a segment of bonds issued in local currency by Japan, Australia, Canada and various European countries) gave back 2% during the quarter, shifting up the global rate curve and reducing by around 30% the share of global negative-yielding debt from its August peak. While their currencies strengthened vs the dollar, Japan, Germany and the UK saw the biggest upward shifts in yield as improved economic outlook nudged investors out of safe-haven assets and into the arguably underbought equity markets in those countries. Emerging market sovereigns were the biggest winners globally in 4Q, adding 3.55% and closing out the year up 8.09%.
Our summary economic view is this: global fundamentals are at an inflection point and likely set to extend the current “low-and-slow” cycle, resulting in a gradual return to above-average GDP growth (thanks to a stable US and upside in Europe and emerging markets). As discussed, that outlook safely assumes a commitment to low policy rates globally, with continued easing where possible even despite tariff progress and an orderly outlook for Brexit.
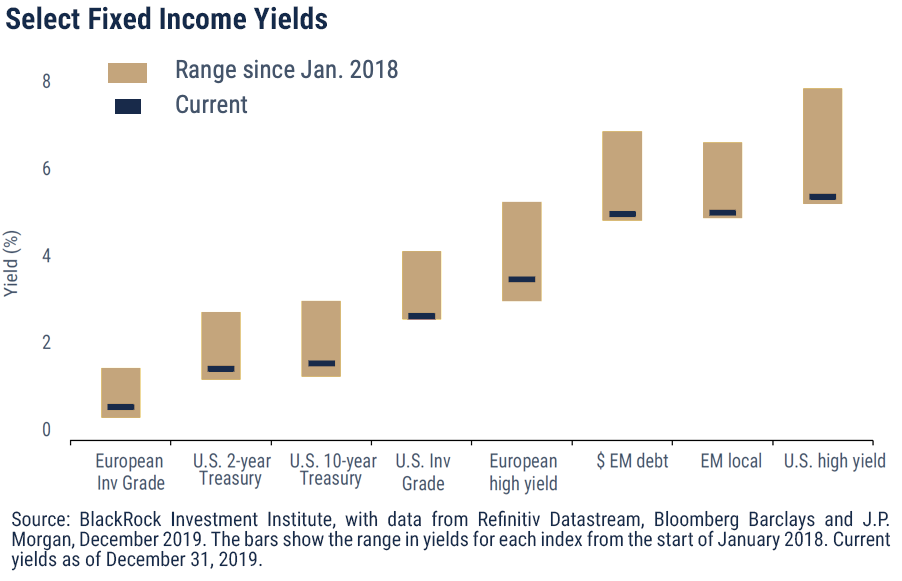
If government and agency bonds are the ballast of a bond portfolio, corporate bonds are the main drivers of current yield (and given our use of actively managed multi-sector bond funds that lean heavily into credit, credit tends to be a structural overweight relative to the Treasury- and mortgage-heavy US Aggregate index). Economic improvement as it relates to issuer fundamentals has been the difference in corporate debt smelling overbought in 2019 versus appearing less speculative at current spread levels. While at no point during the year did we observe any major red flags – such as an uptick in downgrades or defaults, or a downswing in recoveries – there were a few factors that suggested a disconnect between the optimism of risk-asset investors and the faith of actual junk issuers. First, while junk issuance did recover mid-year off a major drought in late 2018, most of the activity was refinancing – corporate de- leveraging despite falling rates and the efforts of the Fed to restart the credit cycle. Beginning in late 2019 and certainly in 2020 to-date, however, junk issuance is on track to pick up significantly, with January volumes below long-term average but robust for a late-cycle environment and, overall, charting a clear rebound and suggesting that issuers may be more bullish than they were in 2019.
As shown in the chart below, even after the bond-rally breather in 4Q we enter 2020 with yields on the low end of recent ranges, implying downside risk even if supply/ demand dynamics and the interest-rate picture are supportive. Despite our outlook for a range-bound bond market, we still see potential for runoff in core bonds as investors unwind defensive positions in order to deploy more bullish views. We note that the concept of a balanced portfolio is predicated on yield and capital preservation from bonds as diversifiers to growth-producing stock allocations; this approach is based on risk/ return characteristics that were essentially violated in 2019’s “bull market for everything.” Long Treasuries – which are viewed as the essential safe haven – were at one point outperforming a robustly positive S&P 500 while moving in the same direction, and those same “riskless” assets fell over 5% in 4Q.
Summary
At press-time, just two weeks into 2020, US equities have already tacked on nearly 2%, while the yield curve continues to shift up and steepen. Ultimately (and reasonably) investors appear satisfied with the near-term retreat of tail risks that emerged in late 2018 and drove episodic volatility throughout 2019. Those risks – namely near-term recession in the US and other developed economies, faltering growth in China and lack of progress on trade or trade-sensitive political dramas such as Brexit – have been effectively subdued, if not totally resolved, by shifts in policy and policy outlook. Between an ongoing (albeit improving) US-China trade conflict, political uncertainty, fragile economic improvement and still-weak growth there remain many threats to corporate performance and investor enthusiasm; nonetheless we see enough evidence to suggest that the global economy turned a corner in late 2019. Global fundamentals appear to have bottomed and the range of critical policy outcomes feels narrower and better-defined than it did even at the outset of the quarter.
Certainly, there are opportunities to capitalize off pro-cyclical forces at work in a recovering - if late-stage - economy, especially given the value that has accrued to overdue rotational trades. Markets may indeed yield healthy returns in 2020, but we still believe it’s highly unlikely those returns land within spitting distance of what investors enjoyed in an extraordinary 2019. Investing is a game of asymmetric risk; rich assets have a long way to fall and even the current economic lifeline does not mean a free lunch for willing investors in “cheap” assets. The attempt to balance growth and capital preservation will be delicate, the hunt for value will be competitive and the risk picture fluid. As always, we remain focused on building a well-diversified mix of assets suited to the goals and situations of our clients; in 2020 we approach that mandate with a resolution to challenge our own assumptions and playbook as it relates to an extraordinary investment environment.
Important Disclosures:
Unless otherwise indicated, performance information for indices, funds and securities as well as various economic data points are sourced from FactSet as of December 31, 2019. This newsletter represents opinions of Wilbanks, Smith and Thomas Asset Management, LLC that are subject to change and do not constitute a recommendation to purchase or sell any security nor to engage in any particular investment strategy. The information contained herein has been obtained from sources believed to be reliable but cannot be guaranteed for accuracy. Some portions of this letter were written in conjunction and collaboration with Capital Markets Consultants Inc. This material is proprietary and being provided on a confidential basis, and may not be reproduced, transferred or distributed in any form without prior written permission from WST. WST reserves the right at any time and without notice to change, amend, or cease publication of the information. This material has been prepared solely for informative purposes. It is made available on an "as-is" basis without warranty. There are no guarantees investment objectives will be met.
The information contained herein has been obtained from sources believed to be reliable but cannot be guaranteed for accuracy. Market indices are unmanaged and do not reflect the deduction of fees or expenses. You cannot invest directly in an index such as these and the performance of an index does not represent the performance of any specific investment strategy. We consider an index to be a portfolio of securities whose composition and proportions are derived from a rules-based model. Market indices are unmanaged and do not reflect the deduction of fees or expenses. You cannot invest directly in an index such as these and the performance of an index does not represent the performance of any specific investment strategy.
The S&P 500 Index is a market capitalization weighted index, including reinvestment of dividends and capital gains distributions that is generally considered representative of U.S. stock market. The Dow Jones Industrial Average (DJIA) is a price-weighted average of 30 significant stocks traded on the New York Stock Exchange (NYSE) and the NASDAQ. The MSCI ACWI Index is a free float-adjusted market capitalization weighted index that is designed to measure the equity market performance of developed and emerging markets. The MSCI ACWI ex USA Index is designed to provide a broad measure of stock performance throughout the world, with the exception of U.S.-based companies. The MSCI EAFE Index is a stock market index that is designed to measure the equity market performance of developed markets outside of the U.S. & Canada. It is maintained by MSCI Barra, a provider of investment decision support tools; the EAFE acronym stands for Europe, Australasia and Far East. The MSCI Emerging Markets Index captures large and mid cap representation across 24 Emerging Markets (EM) countries. With 845 constituents, the index covers approximately 85% of the free float-adjusted market capitalization in each country. The Russell 2000 index measures the performance of the 2,000 smallest companies in the Russell 3000 index. The Bloomberg Barclays U.S. Aggregate Bond Index covers the USD-denominated, investment-grade, fixed-rate, taxable bond market of SEC-registered securities. The index includes bonds from the Treasury, Government-Related, Corporate, MBS, ABS, and CMBS sectors. The BofA Merrill Lynch U.S. High Yield Index tracks the performance of U.S. dollar denominated below investment grade corporate debt publicly issued in the U.S. domestic market. Qualifying securities must have a below investment grade rating (based on an average of Moody’s, S&P and Fitch), at least 18 months to final maturity at the time of issuance, at least one year remaining term to final maturity as of the rebalancing date, a fixed coupon schedule and a minimum amount outstanding of $250 million. The BofA Merrill Lynch 1-3 US Year Treasury Index is an unmanaged index that tracks the performance of the direct sovereign debt of the U.S. Government having a maturity of at least one year and less than three years. The S&P/Citigroup International Treasury Bond ex-U.S. Index measures the performance of treasury bonds, with maturities greater than or equal to one year, issued by non-U.S. developed market countries.
Besides attributed information, this material is proprietary and may not be reproduced, transferred or distributed in any form without prior written permission from WST. WST reserves the right at any time and without notice to change, amend, or cease publication of the information. This material has been prepared solely for informative purposes. The information contained herein may include information that has been obtained from third party sources and has not been independently verified. It is made available on an “as is” basis without warranty. This document is intended for clients for informational purposes only and should not be otherwise disseminated to other third parties. Past performance or results should not be taken as an indication or guarantee of future performance or results, and no representation or warranty, express or implied is made regarding future performance or results. This document does not constitute an offer to sell, or a solicitation of an offer to purchase, any security, future or other financial instrument or product.