
Global Equity Market Review - 4Q 2019
Equity investors closed the books on 2019 – and the “teens” as a whole – in a decidedly bullish mood as global fundamentals showed early evidence of a year’s worth of coordinated monetary easing and fiscal stimulus. There was modest relief in US and Eurozone manufacturing and service sector data, while corporate performance brightened overall as it digested the impacts of rate cuts that began early in the year.
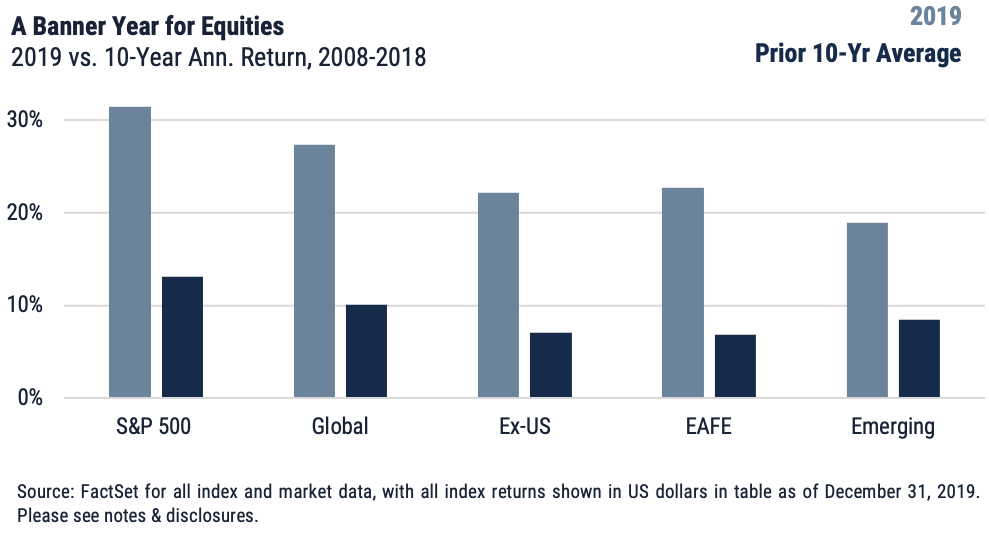
Outlook rallied further on apparent progress in US-China trade talks and a markets-friendly election outcome in the UK. Key stock indices tacked on anywhere from 7% to 12% during the quarter, ending the technical ping-pong match in play throughout most of 2019 and ultimately delivering a stellar year for global shares.
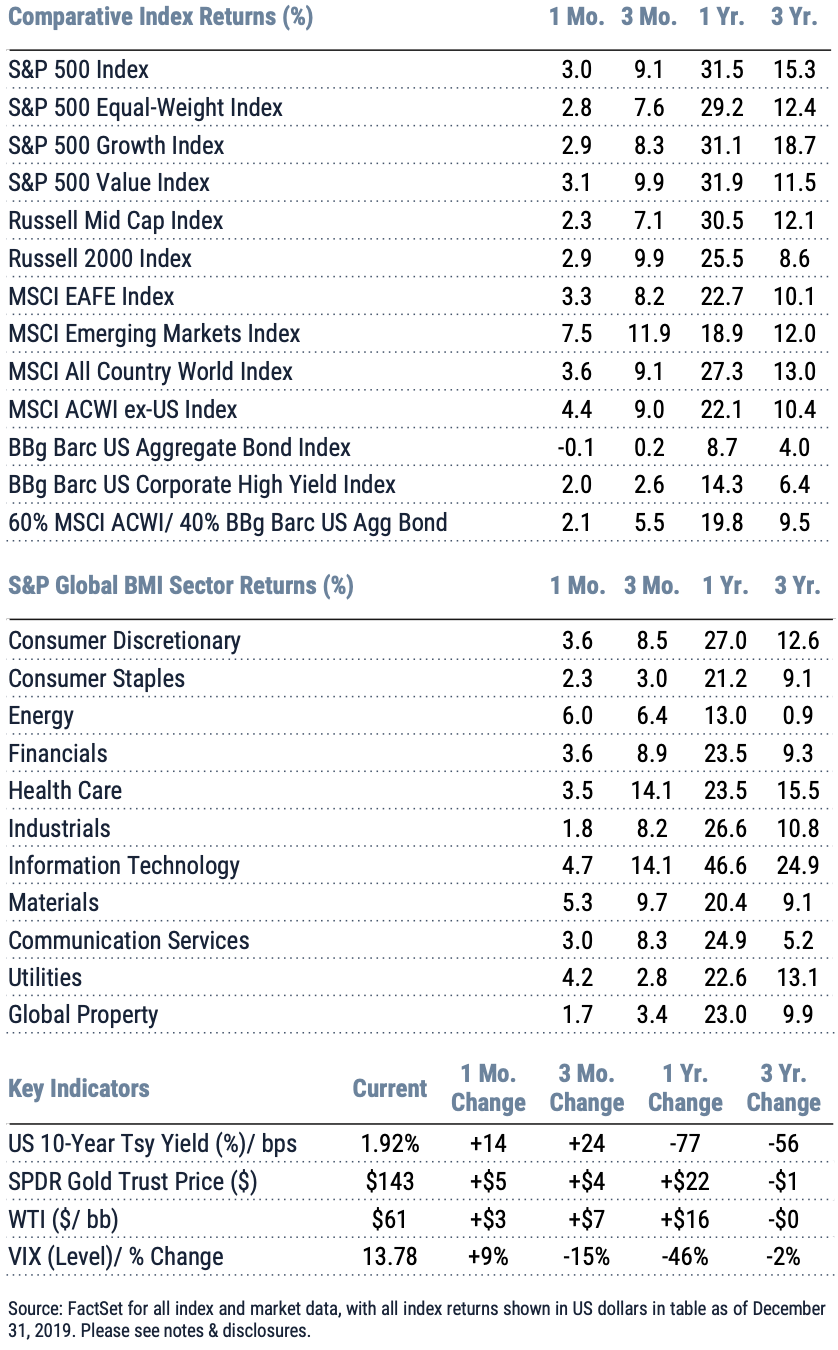
Global equities, as measured by the MSCI ACWI, added 9.1% for the quarter, finishing the year up 27.3%. The S&P 500 also added 9.1% for the quarter, advancing 31.5% for the year; mid-caps lagged (+7.1%) for the period but added 30.5% during the year, while small caps enjoyed a modest advantage in 4Q (+9.9%) but underperformed the S&P 500 by a full 600 basis points for the trailing twelve months. Consistent with the advantage to larger names in 4Q, the S&P 500 Equal-Weight Index was up just 7.6%, ending the year up 29.2%. Headed into 4Q the S&P 500 Value had not led the S&P 500 Growth on a 12-month basis since April 2017; October served to close that gap, as value (+9.9% for the quarter vs. +8.3% for growth) finished the year up 31.9%, a 90-basis point advantage that may hint at a long-awaited style rotation.
Global sectors were uniformly positive during the quarter and year. Technology market leadership – for both 4Q and 2019 overall – reflected the heavy footprint of US tech companies, which were up over 14% for the quarter and a remarkable 50% for the year; it was a US-centric story also in Health Care, the quarter’s second-best performer. Sectors where US share is smaller, at around 50% or less – Energy, Industrials, Utilities, Consumer Staples, Materials – saw positive returns driven by value’s rebound and improvement in the outlook for pro-cyclical companies. The US accounts for just 30% of the global Materials sector, which was December’s second-best performer behind an Energy sector up 6% on rising oil prices and a weakening dollar.
International equities posted a return of 9.0% for the quarter (+22.1% for the year), with currency impacts providing a roughly 250-basis point boost in 4Q and roughly 100 basis points in support for the year. Developed ex-US stocks gained 8.2% during the quarter, marking positive (if comparatively modest) moves in large index constituents such as Japan, Switzerland, France and Germany. Buoyed by election results, the UK kept pace with the US in 4Q.
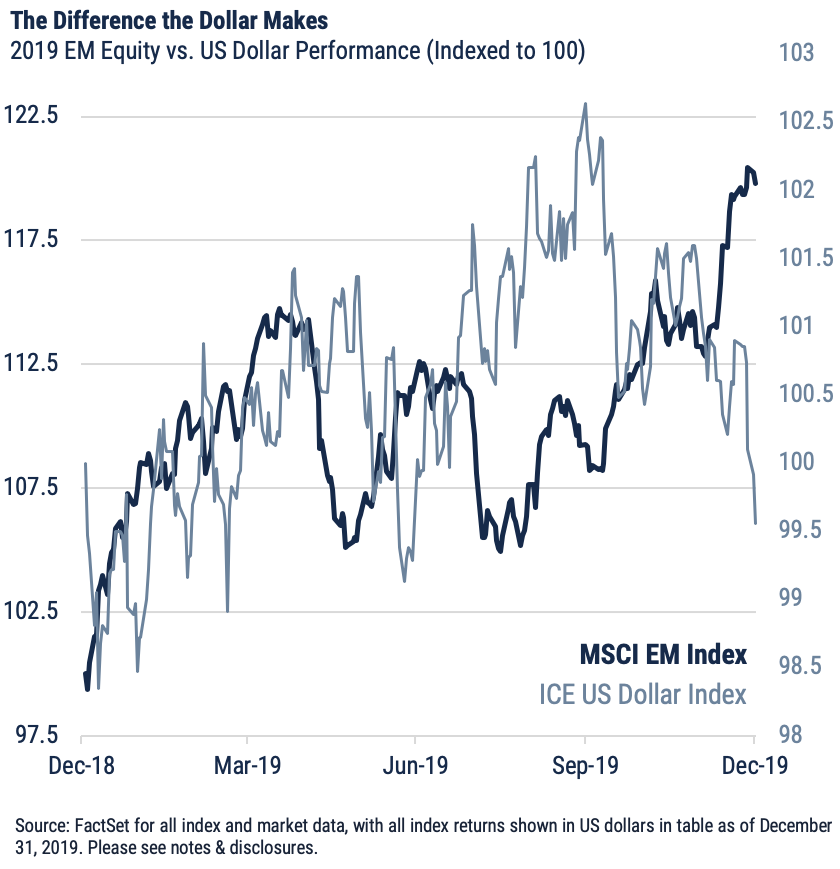
After a solid 2018, emerging markets spent essentially all of 2019 at the mercy of US-China trade headlines and a stubborn US dollar; in 4Q the stars aligned, at least in the short term, for the segment. Guided by positive movement on US-China trade, a brighter global economic outlook and the related lift to non-USD currencies, investors dove back in during 4Q and delivered a market-leading return of 11.9% (+9.63% local). Unsurprisingly given the improvement in trade headlines there were robust bounces in mainland China (+14.7%) and key export-heavy Asian economies such as Korea (+13.2%) and Taiwan (+18.1%); these countries together comprise nearly 60% of the index. Indian equities participated in the trade-related tide but quarterly gains (+5.3%) were relatively muted by signs of slowing expansion for an economy that, a year ago, was set to surpass China in GDP growth rate. There were big winners outside of the trade theme; Brazil rallied 14.4%, while Russia advanced 17.1% on rising oil prices and supportive currency movement. South Africa added 13.2% in USD terms, deriving nearly 900 basis points of return from a surge in the high-yielding rand.
For more market updates, visit the WST blog.
Important Disclosures
Index Returns – all shown in US dollars
All returns shown trailing 12/31/2019 for the period indicated. “YTD” refers to the total return as of prior-year end, while the other returns are annualized. 3-month and annualized returns are shown for:
- The S&P 500 index is comprised of large capitalized companies across many sectors and is generally regarded as representative of US stock market and is provided in this presentation in that regard only.
- The S&P 500® Equal Weight Index (EWI) is the equal-weight version of the widely-used S&P 500. The index includes the same constituents as the capitalization weighted S&P 500, but each company in the S&P 500 EWI is allocated a fixed weight - or 0.2% of the index total at each quarterly rebalance. The S&P 500 equal-weight index (S&P 500 EWI) series imposes equal weights on the index constituents included in the S&P 500 that are classified in the respective GICS® sector.
- The S&P 500 Growth Index is comprised of equities from the S&P 500 that exhibit strong growth characteristics and is weighted by market-capitalization.
- The S&P 500 Value Index is a market-capitalization weighted index comprising of equities from the S&P 500 that exhibit strong value characteristics such as book value to price ratio, cash flow to price ratio, sales to price ratio, and dividend yield.
- The Russell 3000 Index tracks the performance of 3000 U.S. corporations, determined by market-capitalization, and represents 98% of the investable equity market in the United States.
- The Russell Mid Cap Index measures the mid-cap segment performance of the U.S. equity market and is comprised of approximately 800 of the smallest securities based on current index membership and their market capitalization.
- The Russell 2000 Index is a market-capitalization weighted index that measures the performance of 2000 small-cap and mid-cap securities. The index was formulated to give investors an unbiased collection of the smallest tradable equities still meeting exchange listing requirements.
- The MSCI All Country World Index provides a measure of performance for the equity market throughout the world and is a free float-adjusted market capitalization weighted index.
- The MSCI EAFE Index is a market-capitalization weighted index and tracks the performance of small to large-cap equities in developed markets of Europe, Australasia, and the Far East.
- The MSCI Emerging Markets Index is a float-adjusted market-capitalization index that measures equity market performance in global emerging markets and cannot be purchased directly by investors.
- The S&P Global BMI sector indices are into sectors as defined by the widely used Global Industry Classification Standards (GICS) classifications. Each sector index comprises those companies included in the S&P Global BMI that are classified as members of respective GICS® sector. The S&P Global BMI Indices were introduced to provide a comprehensive benchmarking system for global equity investors. The S&P Global BMI is comprised of the S&P Emerging BMI and the S&P Developed BMI. It covers approximately 10,000 companies in 46 countries. To be considered for inclusion in the index, all listed stocks within the constituent country must have a float market capitalization of at least $100 million. For a country to be admitted, it must be politically stable and have legal property rights and procedures, among other criteria.
- The Barclay’s US Aggregate Index, a broad based unmanaged bond index that is generally considered to be representative of the performance of the investment grade, US dollar-denominated, fixed-rate taxable bond market.
- The Bloomberg Barclay’s US Corporate High Yield Index, which covers the USD-denominated, non-investment grade, fixed-rate, taxable corporate bond market.
Key Indicators
Key Indicators correspond to various macro-economic and rate-related data points that we consider impactful to equity markets.
- The US 10-Year Treasury Yield (%)/bps, is the return on investment for the U.S. government’s 10-year debt obligation and serves as a signal for investor confidence.
- SPDR Gold Trust Price ($), is an investment fund that reflects the performance on the price of a gold bullion, less the Trust’s expenses.
- West Texas Intermediate, which is an oil benchmark and the underlying asset in the New York Mercantile Exchange’s oil futures contract.
- CBOE Volatility Index (Level)/% Change, which uses price options on the S&P 500 to estimate the market's expectation of 30-day volatility.
This document is intended for informational purposes only and should not be otherwise disseminated to other third parties. Past performance or results should not be taken as an indication or guarantee of future performance or results, and no representation or warranty, express or implied is made regarding future performance or results. This document does not constitute an offer to sell, or a solicitation of an offer to purchase, any security, future or other financial instrument or product. This material is proprietary and being provided on a confidential basis, and may not be reproduced, transferred or distributed in any form without prior written permission from WST. WST reserves the right at any time and without notice to change, amend, or cease publication of the information. This material has been prepared solely for informative purposes. The information contained herein includes information that has been obtained from third party sources and has not been independently verified. It is made available on an "as is" basis without warranty and does not represent the performance of any specific investment strategy.
We consider an index to be a portfolio of securities whose composition and proportions are derived from a rules-based model. See the appropriate disclosures regarding models, indices and the related performance. You cannot invest directly in an index and the performance of an index does not represent the performance of any specific investment. Some of the information enclosed may represent opinions of WST and are subject to change from time to time and do not constitute a recommendation to purchase and sale any security nor to engage in any particular investment strategy.
Past performance or results should not be taken as an indication or guarantee of future performance or results, and no representation or warranty, express or implied is made regarding future performance or results.
Besides attributed information, this material is proprietary and may not be reproduced, transferred or distributed in any form without prior written permission from WST. WST reserves the right at any time and without notice to change, amend, or cease publication of the information. This material has been prepared solely for informative purposes. The information contained herein may include information that has been obtained from third party sources and has not been independently verified. It is made available on an “as is” basis without warranty. This document is intended for clients for informational purposes only and should not be otherwise disseminated to other third parties. Past performance or results should not be taken as an indication or guarantee of future performance or results, and no representation or warranty, express or implied is made regarding future performance or results. This document does not constitute an offer to sell, or a solicitation of an offer to purchase, any security, future or other financial instrument or product.