
May 2020: Global Equity Market Review
Equity markets around the world continued to add to April’s rally with a focus on incrementally good news on potential vaccines for COVID–19 and concrete plans for reopening economies. In May, cyclical industry groups outperformed less-impacted industries while, for the second consecutive month, small capitalization indexes extended their comeback versus large cap benchmarks. International developed markets rebounded as well aided in part by a declining dollar as investors began unwinding the dollar rally in March. Emerging markets equities continued to lag developed markets as COVID–19 infection and mortality rates have yet to show the same encouraging trends evident in larger countries.
Are equity markets looking too far ahead? This is the number one question investors ask themselves today. It is our belief markets are rational in direction; however, the magnitude of the reaction at times can be dominated by investor emotions driven by a short-term focus on events. Understandably, emotional content in investor behavior appears to be high. The uncertainty caused by COVID-19 impacts us in ways perhaps many have never experienced before. The chart below illustrates the 70 trading days since the mid-February peak – demonstrating just how unusual this pattern is over history, which covers more than 90 years. This is a type of fertile environment for short-term decisions that adversely impact reaching long-term goals.
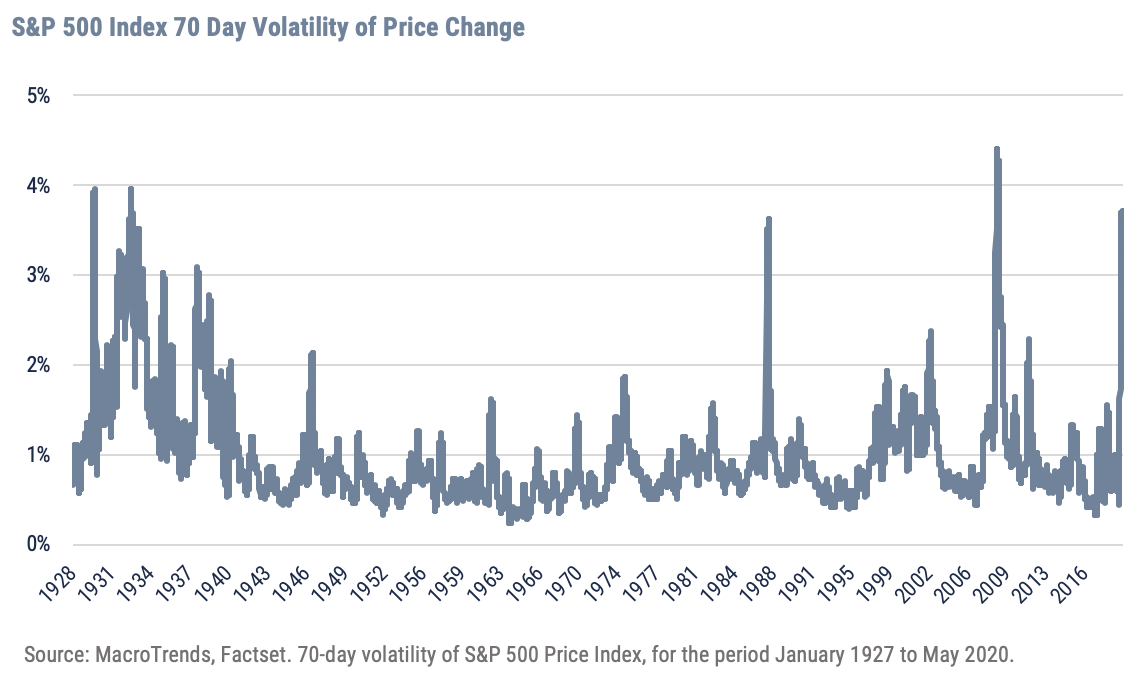
Volatility is measured in both directions and the rally since the March 23rd low is evidence of investor relief over a swift return to more normal business activity.
Looking ahead should be every investor’s perspective as the balance between negative and optimistic news on COVID–19 and the economy shifts toward positive data points. However, the challenge is losing sight of rocky terrain under our feet.
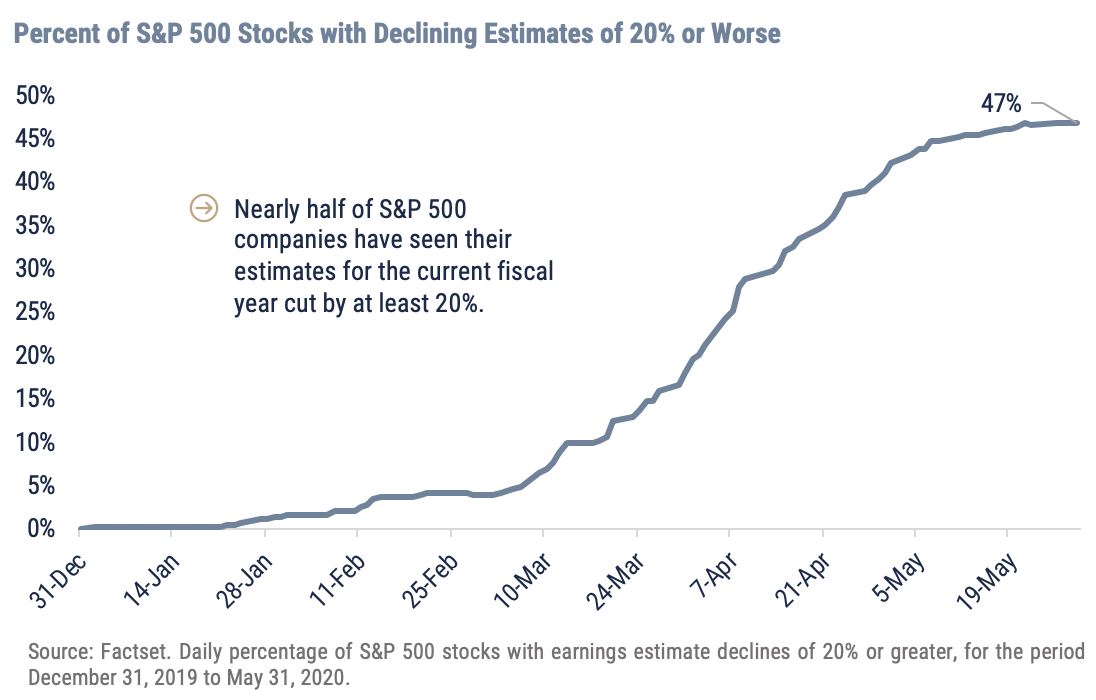
The collapse of earnings brought about by the forced closure of our economy has been dramatic. The second graph (to the right) illustrates almost 50% of companies in the S&P 500 have seen their estimates fall at least 20% from the beginning of year forecasts. In addition, it is estimated a record number of companies have pulled any guidance they typically provide analysts to build sales and earnings models.
It is unlikely investors are fully aware of how the waterfall decline of corporate profits has impacted valuation. Recall the record highs in the U.S. stock market established in February was accompanied by historically high valuations. The market is priced even more expensively today when incorporating the latest estimates from Wall Street analysts. Investor optimism will be tested going forward while markets face the deep valley of earnings as companies release 2Q reports beginning next month.
Rising optimism is a necessary fuel for higher stock prices. When the bar is set low, as it was in late March, incremental moves toward a more constructive outlook can have an outsized impact on the market. In the same context, the brighter the outlook, the higher the bar is set for further advances in expectations. Renewed concern over a resumption in the trade war with China, civil protests in recent days, no clear vaccine for COVID–19 and a national election five months away suggests volatility may not be behind us. If investors watch furthering good news with skepticism, near term advances in stocks will be less likely in the weeks ahead.
Important Disclosures
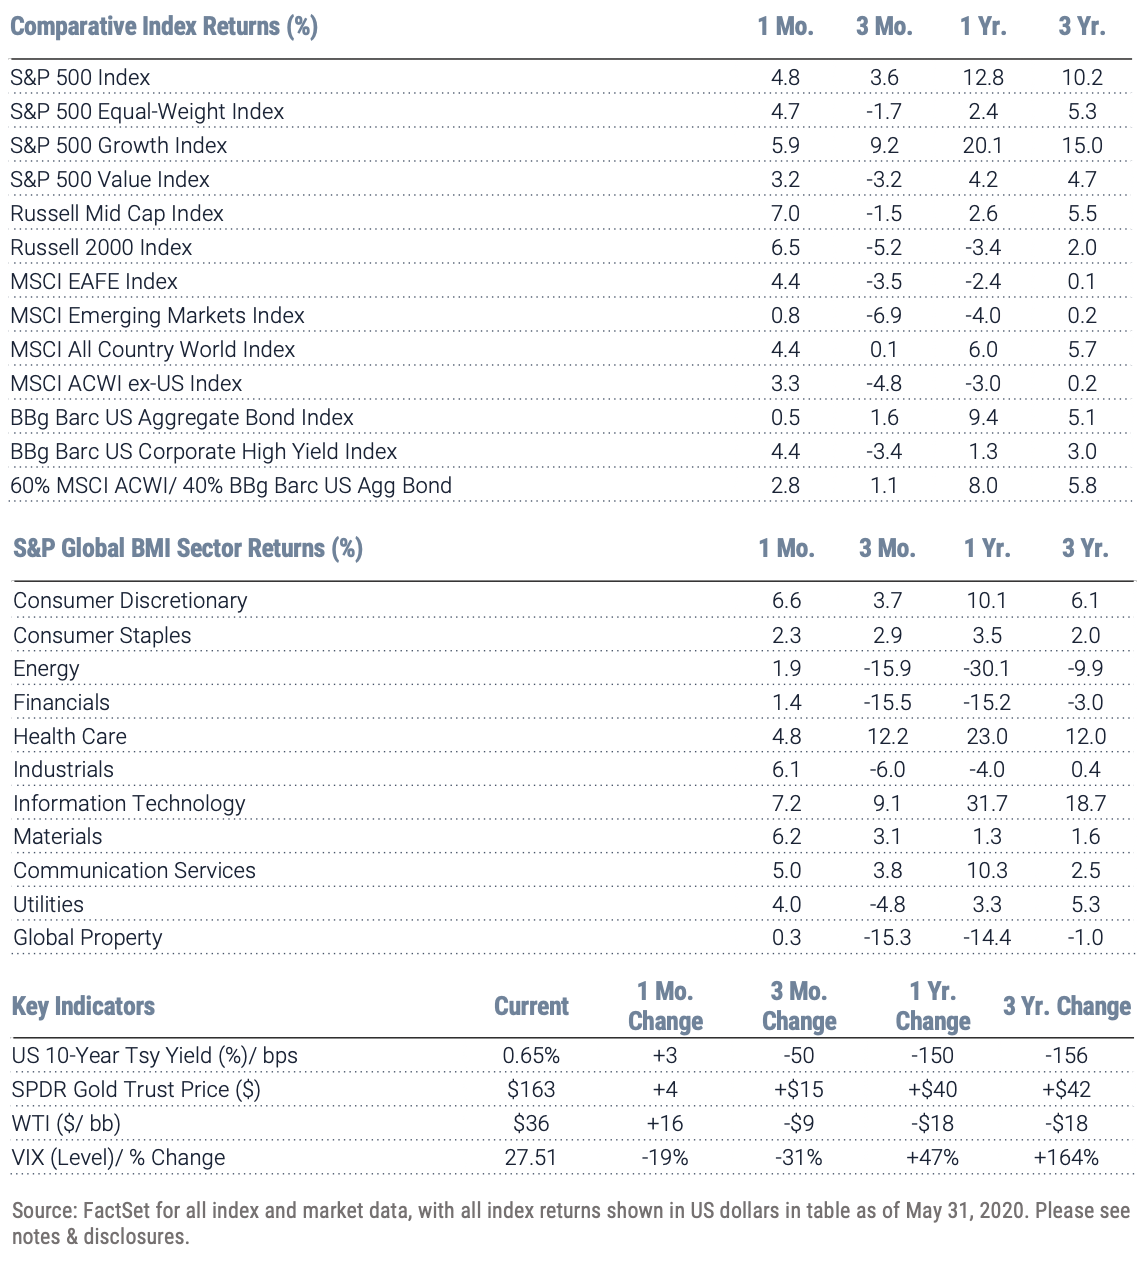
Index Returns – all shown in US dollars
All returns shown trailing 5/31/2020 for the period indicated. “YTD” refers to the total return as of prior-year end, while the other returns are annualized. 3-month and annualized returns are shown for:
- The S&P 500 index is comprised of large capitalized companies across many sectors and is generally regarded as representative of US stock market and is provided in this presentation in that regard only.
- The S&P 500® Equal Weight Index (EWI) is the equal-weight version of the widely-used S&P 500. The index includes the same constituents as the capitalization weighted S&P 500, but each company in the S&P 500 EWI is allocated a fixed weight - or 0.2% of the index total at each quarterly rebalance. The S&P 500 equal-weight index (S&P 500 EWI) series imposes equal weights on the index constituents included in the S&P 500 that are classified in the respective GICS® sector.
- The S&P 500 Growth Index is comprised of equities from the S&P 500 that exhibit strong growth characteristics and is weighted by market-capitalization.
- The S&P 500 Value Index is a market-capitalization weighted index comprising of equities from the S&P 500 that exhibit strong value characteristics such as book value to price ratio, cash flow to price ratio, sales to price ratio, and dividend yield.
- The Russell 3000 Index tracks the performance of 3000 U.S. corporations, determined by market-capitalization, and represents 98% of the investable equity market in the United States.
- The Russell Mid Cap Index measures the mid-cap segment performance of the U.S. equity market and is comprised of approximately 800 of the smallest securities based on current index membership and their market capitalization.
- The Russell 2000 Index is a market-capitalization weighted index that measures the performance of 2000 small-cap and mid-cap securities. The index was formulated to give investors an unbiased collection of the smallest tradable equities still meeting exchange listing requirements.
- The MSCI All Country World Index provides a measure of performance for the equity market throughout the world and is a free float-adjusted market capitalization weighted index.
- The MSCI EAFE Index is a market-capitalization weighted index and tracks the performance of small to large-cap equities in developed markets of Europe, Australasia, and the Far East.
- The MSCI Emerging Markets Index is a float-adjusted market-capitalization index that measures equity market performance in global emerging markets and cannot be purchased directly by investors.
- The S&P Global BMI sector indices are into sectors as defined by the widely used Global Industry Classification Standards (GICS) classifications. Each sector index comprises those companies included in the S&P Global BMI that are classified as members of respective GICS® sector. The S&P Global BMI Indices were introduced to provide a comprehensive benchmarking system for global equity investors. The S&P Global BMI is comprised of the S&P Emerging BMI and the S&P Developed BMI. It covers approximately 10,000 companies in 46 countries. To be considered for inclusion in the index, all listed stocks within the constituent country must have a float market capitalization of at least $100 million. For a country to be admitted, it must be politically stable and have legal property rights and procedures, among other criteria.
- The Barclay’s US Aggregate Index, a broad based unmanaged bond index that is generally considered to be representative of the performance of the investment grade, US dollar-denominated, fixed-rate taxable bond market.
- The Bloomberg Barclay’s US Corporate High Yield Index, which covers the USD-denominated, non-investment grade, fixed-rate, taxable corporate bond market.
Key Indicators
Key Indicators correspond to various macro-economic and rate-related data points that we consider impactful to equity markets.
- The US 10-Year Treasury Yield (%)/bps, is the return on investment for the U.S. government’s 10-year debt obligation and serves as a signal for investor confidence.
- SPDR Gold Trust Price ($), is an investment fund that reflects the performance on the price of a gold bullion, less the Trust’s expenses.
- West Texas Intermediate, which is an oil benchmark and the underlying asset in the New York Mercantile Exchange’s oil futures contract.
- CBOE Volatility Index (Level)/% Change, which uses price options on the S&P 500 to estimate the market's expectation of 30-day volatility.
Wilbanks, Smith & Thomas Asset Management (WST) is an investment adviser registered under the Investment Advisers Act of 1940. Registration as an investment adviser does not imply any level of skill or training. The information presented in the material is general in nature and is not designed to address your investment objectives, financial situation or particular needs. Prior to making any investment decision, you should assess, or seek advice from a professional regarding whether any particular transaction is relevant or appropriate to your individual circumstances. This material is not intended to replace the advice of a qualified tax advisor, attorney, or accountant. Consultation with the appropriate professional should be done before any financial commitments regarding the issues related to the situation are made.
This document is intended for informational purposes only and should not be otherwise disseminated to other third parties. Past performance or results should not be taken as an indication or guarantee of future performance or results, and no representation or warranty, express or implied is made regarding future performance or results. This document does not constitute an offer to sell, or a solicitation of an offer to purchase, any security, future or other financial instrument or product. This material is proprietary and being provided on a confidential basis, and may not be reproduced, transferred or distributed in any form without prior written permission from WST. WST reserves the right at any time and without notice to change, amend, or cease publication of the information. This material has been prepared solely for informative purposes. The information contained herein includes information that has been obtained from third party sources and has not been independently verified. It is made available on an "as is" basis without warranty and does not represent the performance of any specific investment strategy.
We consider an index to be a portfolio of securities whose composition and proportions are derived from a rules-based model. See the appropriate disclosures regarding models, indices and the related performance. You cannot invest directly in an index and the performance of an index does not represent the performance of any specific investment. Some of the information enclosed may represent opinions of WST and are subject to change from time to time and do not constitute a recommendation to purchase and sale any security nor to engage in any particular investment strategy.
Besides attributed information, this material is proprietary and may not be reproduced, transferred or distributed in any form without prior written permission from WST. WST reserves the right at any time and without notice to change, amend, or cease publication of the information. This material has been prepared solely for informative purposes. The information contained herein may include information that has been obtained from third party sources and has not been independently verified. It is made available on an “as is” basis without warranty. This document is intended for clients for informational purposes only and should not be otherwise disseminated to other third parties. Past performance or results should not be taken as an indication or guarantee of future performance or results, and no representation or warranty, express or implied is made regarding future performance or results. This document does not constitute an offer to sell, or a solicitation of an offer to purchase, any security, future or other financial instrument or product.