
May 2020: Fixed Income Market Review
May was another strong month for fixed income assets as the Fed continued to provide ample liquidity while phase one of reopening the U.S. economy initiated. U.S. corporate credit was positive across the board – outperforming safe-haven assets that investors have flocked to over the last few months. The Bloomberg Barclays U.S. Aggregate finished the month up 47 bps, pushing the index’s year-to-date total return to 5.47%.
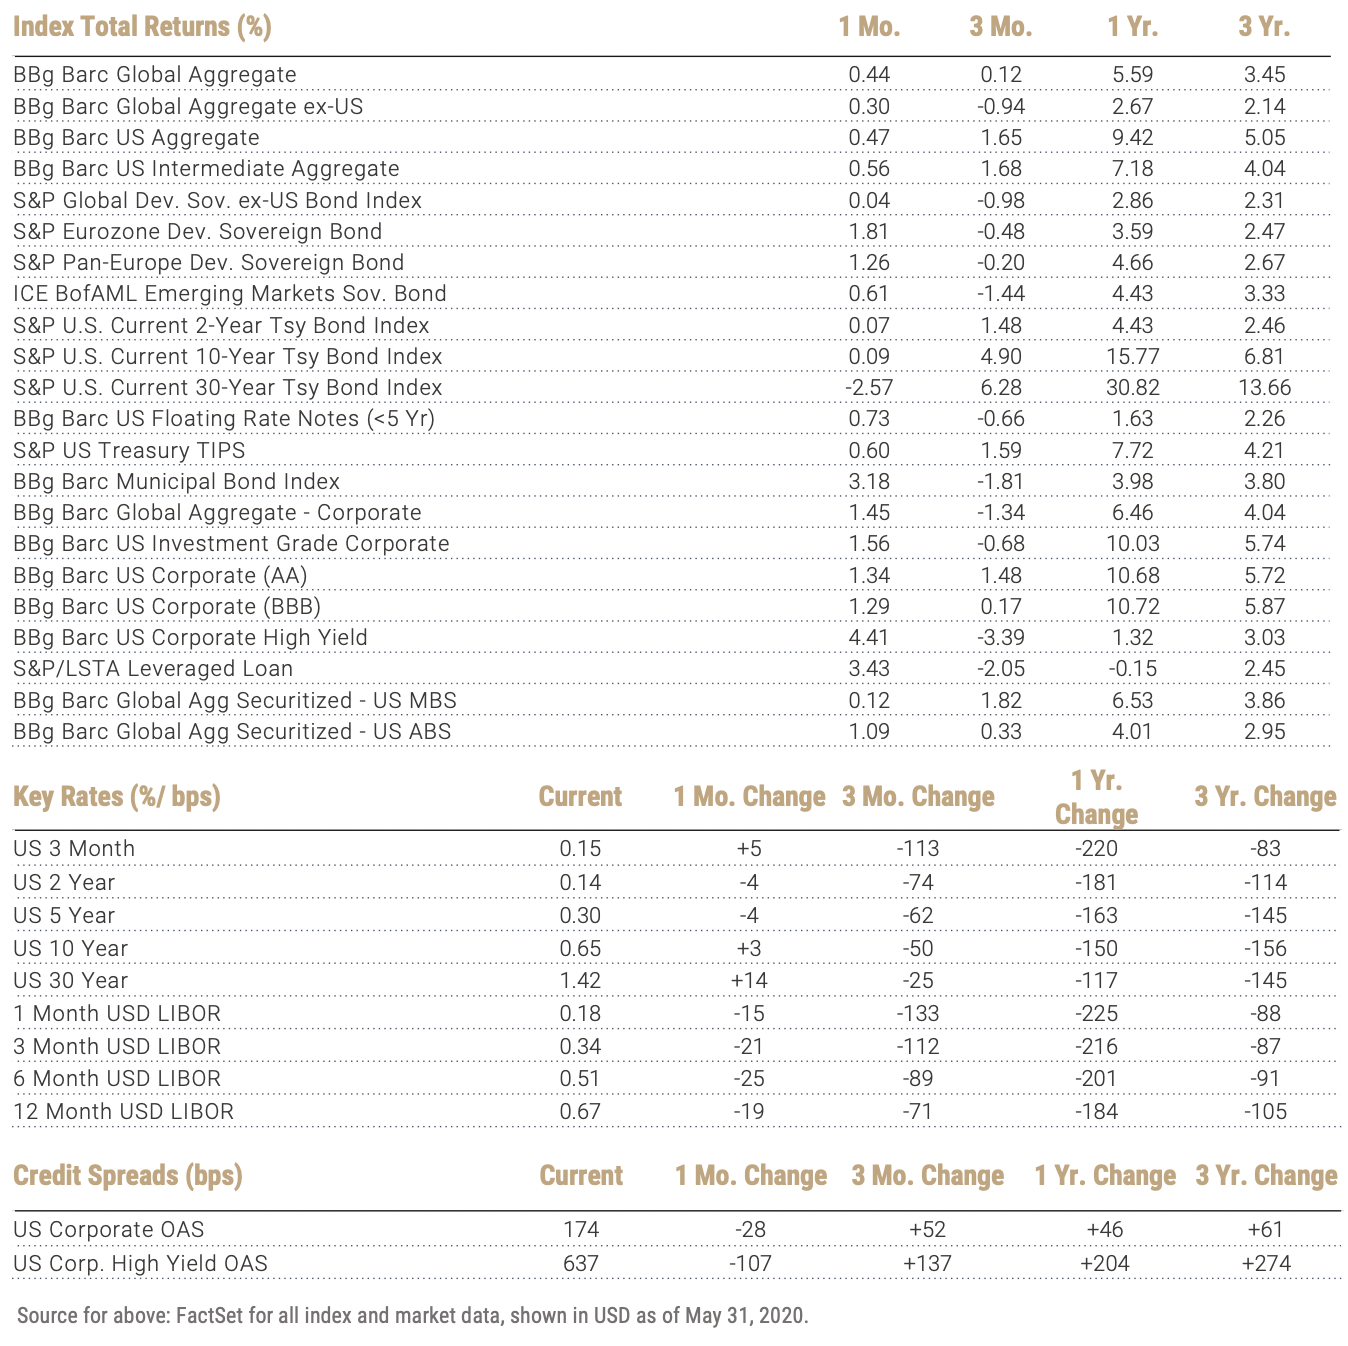
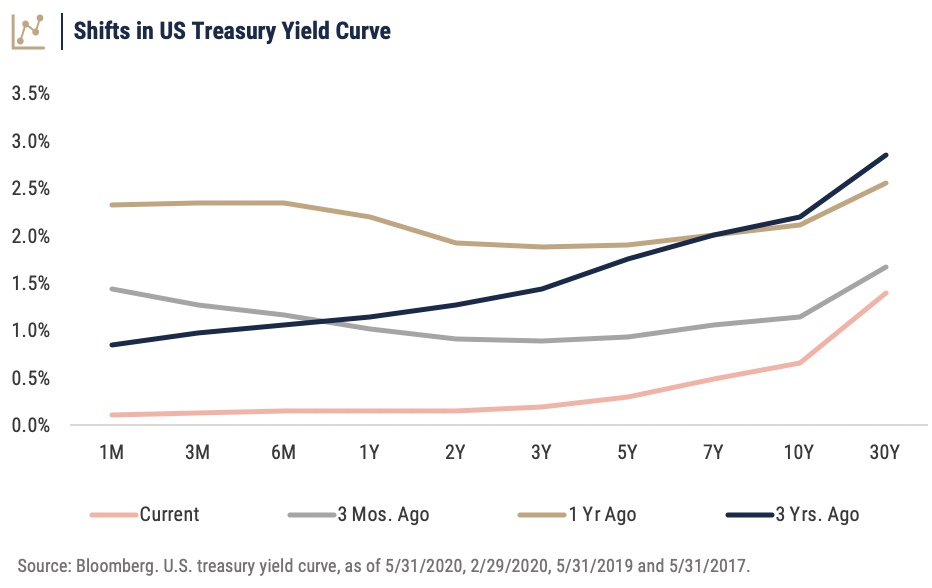
Short and intermediate maturity U.S. Treasury rates were little changed for the month. However, additional supply coming from the U.S. Treasury’s twenty-year bond auction, coupled with positive news regarding COVID-19, caused investors to recalibrate their long-term growth and inflation expectations, pushing up yields at the long end of the curve. While the Bloomberg Barclays U.S. Treasury Index finished the month down 25 bps, it’s still one of the best performing fixed income sectors for the year – up 8.61%.
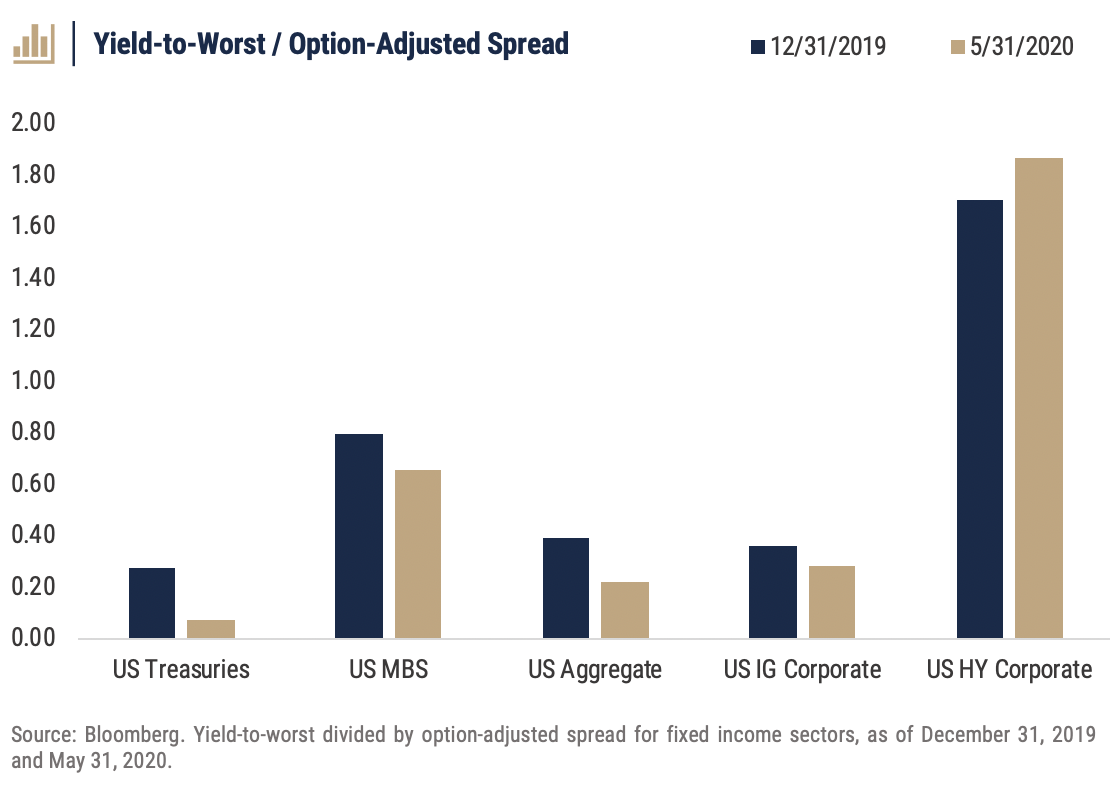
While having exposure to treasuries this year has benefited investors, it has opened them up to a substantial amount of interest rate risk.
As of the end of May, the Bloomberg Barclays U.S. Treasury Index had a yield-to-duration ratio of 0.07. This means that if an investor were able to purchase the index at current levels, the yield on the index itself would only need to increase by 7 bps to completely erase the coupon return. As a result, we may continue to see strong performance from Agency MBS – a ratio nine times greater than that of the Treasury index – as measured by the Bloomberg Barclays MBS Index.
Spread products' recovery persisted throughout the month, with U.S. investment grade and high yield returning 1.56% and 4.41%, respectively. Although credit spreads remain elevated compared to the end of 2019, they have tightened considerably since late March. As the U.S. economy reopens, spreads may contract further as market participants reassess their credit outlook.
While the economic landscape remains questionable, support from the Fed is expected to continue to stabilize the fixed income markets allowing companies to have easier access to capital markets in order to fund operations.
Important Disclosures
Index Returns – all shown in US dollars
All returns shown trailing 5/31/2020 for the period indicated. “YTD” refers to the total return as of prior-year end, while the other returns are annualized. 3-month and annualized returns are shown for:
- The Barclay’s US Aggregate Index, a broad-based unmanaged bond index that is generally considered to be representative of the performance of the investment grade, US dollar-denominated, fixed-rate taxable bond market.
- The ICE BofAML Emerging Markets Sovereign Bond Index is a subset of The BofA Merrill Lynch World Sovereign Bond Index excluding all securities with a country of risk that is a member of the FX G10, all Western European countries, and territories of the U.S. and Western European countries. The FX G10 includes all Euro members, the U.S., Japan, the U.K., Canada, Australia, New Zealand, Switzerland, Norway, and Sweden.
- The Bloomberg Barclays Global Aggregate Index, which measures global investment grade debt from twenty-four local currency markets. This multi-currency benchmark includes treasury, government-related, corporate and securitized fixed-rate bonds from both developed and emerging markets issuers.
- The S&P Global Developed Sovereign Bond index includes local-currency denominated debt publicly issued by governments in their domestic markets.
- S&P Eurozone Developed Sovereign Bond - seeks to measure the performance of Eurozone government bonds.
- The S&P Pan-Europe Developed Sovereign Bond Index is a comprehensive, market-value-weighted index designed to track the performance of local currency-denominated securities publicly issued by Denmark, Norway, Sweden, Switzerland, the U.K. and developed countries in the Eurozone for their domestic markets.
- ICE BofAML Emerging Markets Sovereign Bond - tracks the performance of US dollar (USD) and Euro denominated emerging markets non-sovereign debt publicly issued within the major domestic and Eurobond markets.
- The Bloomberg Barclay’s US Corporate Bond Index (AA), which measures the investment grade, fixed-rate, taxable corporate bond market. It includes USD denominated securities publicly issued by US and non-US industrial, utility and financial issuers.
- The Bloomberg Barclay’s US Corporate High Yield Index, which covers the USD-denominated, non-investment grade, fixed-rate, taxable corporate bond market.
- Bloomberg Barclay’s Global Aggregate Securitized- US Mortgage-Backed Securities, which is a component of the Bloomberg Barclay’s US Aggregate Index and measures investment grade mortgage backed pass-through securities of GNMA, FNMA, and FHLMC.
- Bloomberg Barclay’s Global Aggregate Securitized- US Asset-Backed Securities, which is a component of the Bloomberg Barclay’s US Aggregate Index and includes the pass-throughs, bullets, and controlled amortization structures of only the senior class of ABS issues.
- The Blomberg Barclay’s US Floating Rate Notes (<5 Yr) Index, measures the performance of U.S dollar-dominated, investment grade floating rate notes with maturities less than 5 years.
- The Bloomberg Barclay’s Municipal Bond Index, which measures investment grade, tax-exempt bonds with a maturity of at least one year.
- The S&P/ LSTA Leveraged Loan Index is designed to reflect the performance of the largest facilities in the leveraged loan market.
- The S&P U.S. TIPS Index is a broad, comprehensive, market value-weighted index that seeks to measure the performance of the U.S. Treasury Inflation-Protected Securities (TIPS) market.
- The S&P U.S. Treasury Bond Current 2-Year Index is a one-security index comprising the most recently issued 2-year U.S. Treasury note or bond.
- The S&P U.S. Treasury Bond Current 10-Year Index is a one-security index comprising the most recently issued 10-year U.S. Treasury note or bond.
- The S&P U.S. Treasury Bond Current 30-Year Index is a one-security index comprising the most recently issued 30-year U.S. Treasury note or bond.
Key Rates
Key Rates are shown for US Treasuries and London Interbank Offered Rate (LIBOR), the interest rate at which banks offer to lend funds (wholesale money) to one another in the international interbank market. LIBOR is a key benchmark rate that reflects how much it costs banks to borrow from each other. “Current” refers to the percentage rate as of 6/30/2018, while the rates of change are stated in basis points.
Credit Spreads
Credit Spreads shown comprise the Option-Adjusted Spread of the indices indicated, versus the US 10-Year Treasury Yield. “Current” refers to the spread as of 6/30/2018, while the rates of change are stated in basis points.
Key Indicators
Key Indicators correspond to various macro-economic and rate-related data points that we consider impactful to fixed income markets.
- 2s10s (bps)/ 10 Yr vs 2 Yr Treasury Spread, which measures the difference between yields on 10-Year Treasury Constant Maturity Securities and 2-Year Treasury Constant Maturity Securities.
- West Texas Intermediate, which is an oil benchmark and the underlying asset in the New York Mercantile Exchange’s oil futures contract.
- Core Consumer Price Index, which measures the consumer price index excluding food and energy prices. Shown as of the prior month-end.
- Breakeven Inflation: 5 Yr %/ bps, which uses a moving 30-day average of the 5-Year Treasury Constant Maturity Securities and 5-Year Treasury Inflation–Indexed Constant Maturity Securities to derive expected inflation.
- Breakeven Inflation: 10 Yr %/ bps, which uses a moving 30-day average of the 10-Year Treasury Constant Maturity Securities and 10-Year Treasury Inflation–Indexed Constant Maturity Securities to derive expected inflation.
General Disclosure
Wilbanks, Smith & Thomas Asset Management (WST) is an investment adviser registered under the Investment Advisers Act of 1940. Registration as an investment adviser does not imply any level of skill or training. The information presented in the material is general in nature and is not designed to address your investment objectives, financial situation or particular needs. Prior to making any investment decision, you should assess, or seek advice from a professional regarding whether any particular transaction is relevant or appropriate to your individual circumstances. This material is not intended to replace the advice of a qualified tax advisor, attorney, or accountant. Consultation with the appropriate professional should be done before any financial commitments regarding the issues related to the situation are made.
This document is intended for informational purposes only and should not be otherwise disseminated to other third parties. Past performance or results should not be taken as an indication or guarantee of future performance or results, and no representation or warranty, express or implied is made regarding future performance or results. This document does not constitute an offer to sell, or a solicitation of an offer to purchase, any security, future or other financial instrument or product. This material is proprietary and being provided on a confidential basis, and may not be reproduced, transferred or distributed in any form without prior written permission from WST. WST reserves the right at any time and without notice to change, amend, or cease publication of the information. The information contained herein includes information that has been obtained from third party sources and has not been independently verified. It is made available on an "as is" basis without warranty and does not represent the performance of any specific investment strategy.
An index is a portfolio of specific securities, the performance of which is often used as a benchmark in judging the relative performance to certain asset classes. Index performance used throughout is intended to illustrate historical market trends and performance. Indexes are managed and do not incur investment management fees. An investor is unable to invest in an index.
Some of the information enclosed may represent opinions of WST and are subject to change from time to time and do not constitute a recommendation to purchase and sale any security nor to engage in any particular investment strategy. The information contained herein has been obtained from sources believed to be reliable but cannot be guaranteed for accuracy. Securities and services are not FDIC or any other government agency insured – Are not bank guaranteed – May lose Value.
Besides attributed information, this material is proprietary and may not be reproduced, transferred or distributed in any form without prior written permission from WST. WST reserves the right at any time and without notice to change, amend, or cease publication of the information. This material has been prepared solely for informative purposes. The information contained herein may include information that has been obtained from third party sources and has not been independently verified. It is made available on an “as is” basis without warranty. This document is intended for clients for informational purposes only and should not be otherwise disseminated to other third parties. Past performance or results should not be taken as an indication or guarantee of future performance or results, and no representation or warranty, express or implied is made regarding future performance or results. This document does not constitute an offer to sell, or a solicitation of an offer to purchase, any security, future or other financial instrument or product.