
July 2018 Global Equity Markets Review
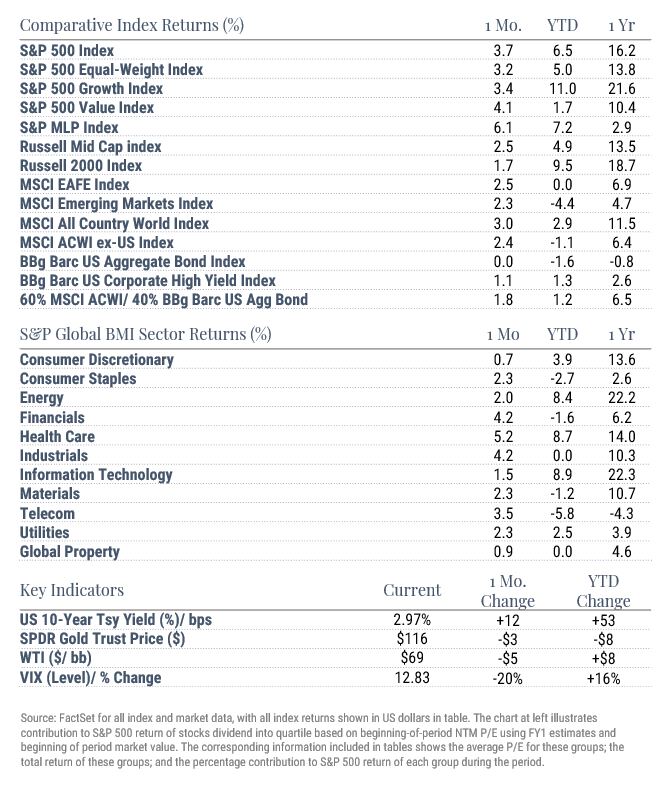
After mixed results in June, global stocks enjoyed strong returns in July. US equities rose for the fourth month in a row and retained the pole position within global equities (+3.0%), with the S&P 500 Index up 3.7% vs. returns of 2.5% for the MSCI EAFE Index and 2.3% for the MSCI Emerging Markets Index. Driving markets were strong earnings reports as investors were treated to a dazzling (if anomalous) US GDP growth figure and headlines signaled progress in both EU-US trade and NAFTA discussions; late-month rumors of renewed talks with China were further encouraging. Relief was notable for emerging markets, which had fallen nearly 7% in the four prior months. Volatility seemed to dissolve as the VIX fell 20% during the month, closing out June down around 65% off its February peak.
Spotlight: Value vs. Growth
After equaling the S&P 500 Growth return in June, the S&P 500 Value led by a solid 60 basis points in July, prompting speculation about the long-awaited comeback of a category that has felt dormant in a market driven by the so-called “FAANG” trade (the FAANGs, plus related story Microsoft, are all Growth Index constituents). Meanwhile, Facebook and Netflix were punished for earnings; the two stocks set back the S&P 500 30 bps total. FB & NFLIX cost the S&P 500 Growth even more – at around -55 bps, the negative impact was just a few basis points shy of the overall spread between the Growth & Value indices. So what did we see in July – true signs of life from value stocks, or simply a different angle on the FAANG story?
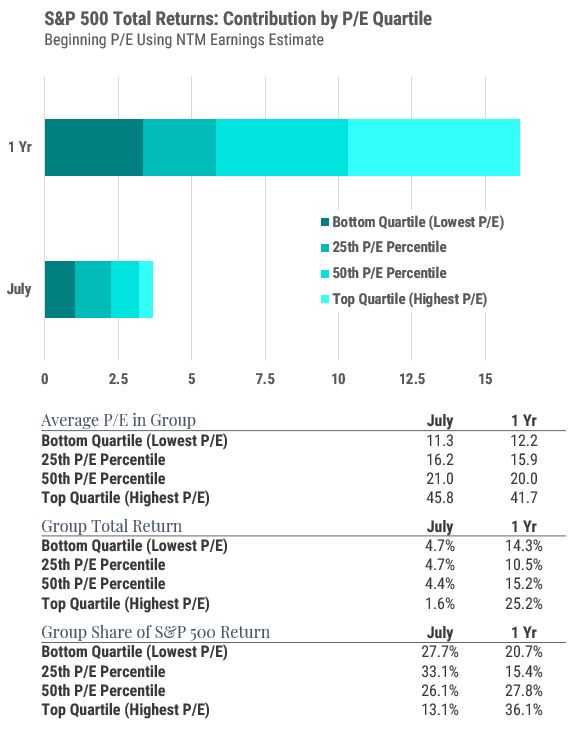
Looking beyond the style index groups to put the value-growth dynamic into fundamental perspective, the chart below breaks down the contributions of four P/E groups to the S&P 500’s 3.7% total return in July and its 16.2% return for the one-year period. Over the past year the “expensive” half of the market contributed 65% of the return, while the “cheaper” half contributed just 35% (notably, Apple’s P/E places it in the less expensive half of the spectrum although it is an S&P 500 Growth stock). July did seemingly flip the script, with the less expensive half of the market contributing over 60% of return. The FB/ NFLIX drag was more than negated by contributions from Google and Amazon, and yet had FB & NFLIX returned 0% during the month the top-P/E quartile still would have come in last, and the “cheapest” stocks would still have enjoyed their moment in the July sun.
Arguably July told both stories. A rare FAANG hiccup served to remind us of the flipside of the trade that has driven US equities upward – that is, markets also bear the weight of those stocks on the downswing. At the same time it seems that the value investing faithful are rightfully encouraged by the performance of cheaper stocks in recent periods.
For similar market reviews, visit the WST blog's Market Updates category.
Index Returns – all shown in US dollar - All returns shown trailing 7/31/2018 for the period indicated. “YTD” refers to the total return as of prior-year end, while the other returns are annualized. 3-month and annualized returns are shown for:
- The S&P 500 index is comprised of large capitalized companies across many sectors and is generally regarded as representative of US stock market and is provided in this presentation in that regard only.
- The S&P 500® Equal Weight Index (EWI) is the equal-weight version of the widely-used S&P 500. The index includes the same constituents as the capitalization weighted S&P 500, but each company in the S&P 500 EWI is allocated a fixed weight - or 0.2% of the index total at each quarterly rebalance. The S&P 500 equal-weight index (S&P 500 EWI) series imposes equal weights on the index constituents included in the S&P 500 that are classified in the respective GICS® sector.
- The S&P 500 Growth Index is comprised of equities from the S&P 500 that exhibit strong growth characteristics and is weighted by market-capitalization.
- The S&P 500 Value Index is a market-capitalization weighted index comprising of equities from the S&P 500 that exhibit strong value characteristics such as book value to price ratio, cash flow to price ratio, sales to price ratio, and dividend yield.
- The Russell 3000 Index tracks the performance of 3000 U.S. corporations, determined by market-capitalization, and represents 98% of the investable equity market in the United States.
- The Russell Mid Cap Index measures the mid-cap segment performance of the U.S. equity market and is comprised of approximately 800 of the smallest securities based on current index membership and their market capitalization.
- The Russell Micro Cap Index is a market-capitalization weighted index that measures the performance of 2000 small-cap and mid-cap securities. The index was formulated to give investors an unbiased collection of the smallest tradable equities still meeting exchange listing requirements.
- The MSCI All Country World Index provides a measure of performance for the equity market throughout the world and is a free float-adjusted market capitalization weighted index.
- The MSCI EAFE Index is a market-capitalization weighted index and tracks the performance of small to large-cap equities in developed markets of Europe, Australasia, and the Far East.
- The MSCI Emerging Markets Index is a float-adjusted market-capitalization index that measures equity market performance in global emerging markets and cannot be purchased directly by investors.
- The S&P Global BMI sector indices are into sectors as defined by the widely used Global Industry Classification Standards (GICS) classifications. Each sector index comprises those companies included in the S&P Global BMI that are classified as members of respective GICS® sector. The S&P Global BMI Indices were introduced to provide a comprehensive benchmarking system for global equity investors. The S&P Global BMI is comprised of the S&P Emerging BMI and the S&P Developed BMI. It covers approximately 10,000 companies in 46 countries. To be considered for inclusion in the index, all listed stocks within the constituent country must have a float market capitalization of at least $100 million. For a country to be admitted, it must be politically stable and have legal property rights and procedures, among other criteria.
- The Barclay’s US Aggregate Index, a broad based unmanaged bond index that is generally considered to be representative of the performance of the investment grade, US dollar-denominated, fixed-rate taxable bond market.
- The Bloomberg Barclay’s US Corporate High Yield Index, which covers the USD-denominated, non-investment grade, fixed-rate, taxable corporate bond market.
Key Indicators - Key Indicators correspond to various macro-economic and rate-related data points that we consider impactful to equity markets.
- The US 10-Year Treasury Yield (%)/bps, is the return on investment for the U.S. government’s 10-year debt obligation and serves as a signal for investor confidence.
- SPDR Gold Trust Price ($), is an investment fund that reflects the performance on the price of a gold bullion, less the Trust’s expenses.
- West Texas Intermediate, which is an oil benchmark and the underlying asset in the New York Mercantile Exchange’s oil futures contract.
- CBOE Volatility Index (Level)/% Change, which uses price options on the S&P 500 to estimate the market's expectation of 30-day volatility.
General Disclosure - This document is intended for informational purposes only and should not be otherwise disseminated to other third parties. Past performance or results should not be taken as an indication or guarantee of future performance or results, and no representation or warranty, express or implied is made regarding future performance or results. This document does not constitute an offer to sell, or a solicitation of an offer to purchase, any security, future or other financial instrument or product. This material is proprietary and being provided on a confidential basis, and may not be reproduced, transferred or distributed in any form without prior written permission from WST. WST reserves the right at any time and without notice to change, amend, or cease publication of the information. This material has been prepared solely for informative purposes. The information contained herein includes information that has been obtained from third party sources and has not been independently verified. It is made available on an "as is" basis without warranty and does not represent the performance of any specific investment strategy.
This commentary also includes performance figures for the SPDR Gold Trust (GLD), which is held in the SSRM model but in this case is used as a proxy for the performance of the asset class, given the security’s prominence as a means of accessing exposure to the asset class. We believe use of this proxy is appropriate in the context of providing our clients and Advisors with relevant information about markets. We consider an index to be a portfolio of securities whose composition and proportions are derived from a rules-based model. See the appropriate disclosures regarding models, indices and the related performance. You cannot invest directly in an index and the performance of an index does not represent the performance of any specific investment. Some of the information enclosed may represent opinions of WST and are subject to change from time to time and do not constitute a recommendation to purchase and sale any security nor to engage in any particular investment strategy.
Past performance or results should not be taken as an indication or guarantee of future performance or results, and no representation or warranty, express or implied is made regarding future performance or results. This document does not constitute an offer to sell, or a solicitation of an offer to purchase, any security, future or other financial instrument or product. This material is proprietary and being provided on a confidential basis, and may not be reproduced, transferred or distributed in any form without prior written permission from WST. WST reserves the right at any time and without notice to change, amend, or cease publication of the information. This material has been prepared solely for informative purposes. The information contained herein includes information that has been obtained from third party sources and has not been independently verified. It is made available on an "as is" basis without warranty and does not represent the performance of any specific investment .Some of the information enclosed may represent opinions of WST and are subject to change from time to time and do not constitute a recommendation to purchase and sale any security nor to engage in any particular investment strategy. The information contained herein has been obtained from sources believed to be reliable but cannot be guaranteed for accuracy. Past performance is not necessarily indicative of future results. Securities and services are not FDIC or any other government agency insured – Are not bank guaranteed – May lose Value.
Besides attributed information, this material is proprietary and may not be reproduced, transferred or distributed in any form without prior written permission from WST. WST reserves the right at any time and without notice to change, amend, or cease publication of the information. This material has been prepared solely for informative purposes. The information contained herein may include information that has been obtained from third party sources and has not been independently verified. It is made available on an “as is” basis without warranty. This document is intended for clients for informational purposes only and should not be otherwise disseminated to other third parties. Past performance or results should not be taken as an indication or guarantee of future performance or results, and no representation or warranty, express or implied is made regarding future performance or results. This document does not constitute an offer to sell, or a solicitation of an offer to purchase, any security, future or other financial instrument or product.