
July 2018 Fixed Income Markets Review
While not positive overall for global fixed income markets, July’s mixed returns saw losses less severe than the prior month, while some sectors strengthened. With short-term yields relatively stable, increased inflation expectations caused a modest rise in long-term yields in the US. The Bloomberg Barclays US Aggregate Index was flat while the Bloomberg Barclays Global Aggregate ex-US fell 36 basis points; the Bloomberg Barclays Global Aggregate shook out with a loss, returning -0.17% for the month.
Spotlight: High Yield
As broad indices and various sectors of the US and global bond markets struggled throughout most of 2Q, high yield managed to hold its own; July saw more of the same outperformance even as other US bond sectors stabilized and saw positive returns for the month. The asset class now leads US aggregate bonds by 340 basis points year-to-date and US investment-grade corporates by nearly 320 bps year-to-date.
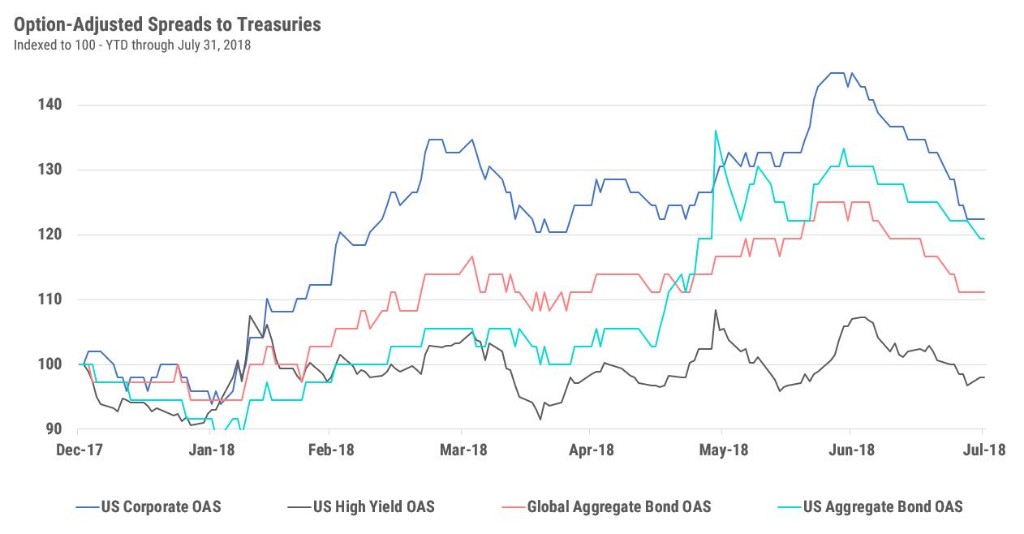
The high yield sector has enjoyed strong performance despite continued narrowness and modest spread movement relative to other sectors, as shown in the chart below, and evidently on the basis of fundamental strength and attractiveness relative to other bond sectors expected to suffer in a rising-rate environment. Year-to-date the daily option-adjusted spread on high yield has averaged around +340 bps. Further tightening in July left the spread at 336 basis points – a figure that lands it in the 18th percentile, based on data dating to 1995. In other words, spreads have been tighter only around 18% of the time.
For similar market reviews, visit the WST blog's Market Updates category.
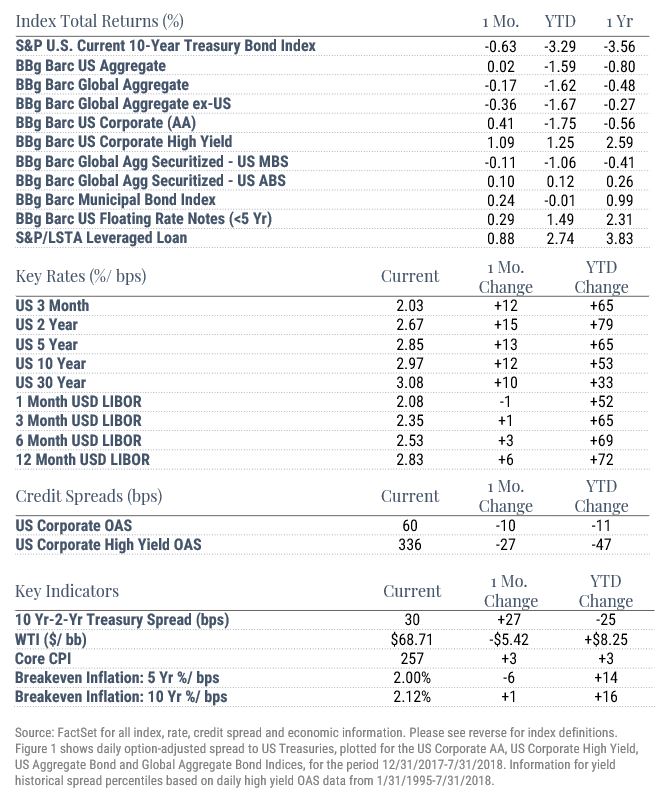
Index Returns – all shown in US dollars
All returns shown trailing 7/31/2018 for the period indicated. “YTD” refers to the total return as of prior-year end, while the other returns are annualized. 3-month and annualized returns are shown for:
The Barclay’s US Aggregate Index, a broad based unmanaged bond index that is generally considered to be representative of the performance of the investment grade, US dollar-denominated, fixed-rate taxable bond market.
- The Bloomberg Barclays Global Aggregate Index, which measures global investment grade debt from twenty-four local currency markets. This multi-currency benchmark includes treasury, government-related, corporate and securitized fixed-rate bonds from both developed and emerging markets issuers.
- The Bloomberg Barclay’s US Corporate Bond Index (AA), which measures the investment grade, fixed-rate, taxable corporate bond market. It includes USD denominated securities publicly issued by US and non-US industrial, utility and financial issuers.
- The Bloomberg Barclay’s US Corporate High Yield Index, which covers the USD-denominated, non-investment grade, fixed-rate, taxable corporate bond market.
- Bloomberg Barclay’s Global Aggregate Securitized- US Mortgage-Backed Securities, which is a component of the Bloomberg Barclay’s US Aggregate Index and measures investment grade mortgage backed pass-through securities of GNMA, FNMA, and FHLMC.
- Bloomberg Barclay’s Global Aggregate Securitized- US Asset-Backed Securities, which is a component of the Bloomberg Barclay’s US Aggregate Index and includes the pass-throughs, bullets, and controlled amortization structures of only the senior class of ABS issues.
- The Blomberg Barclay’s US Floating Rate Notes (<5 Yr) Index, measures the performance of U.S dollar-dominated, investment grade floating rate notes with maturities less than 5 years.
- The Bloomberg Barclay’s Municipal Bond Index, which measures investment grade, tax-exempt bonds with a maturity of at least one year.
- The S&P/ LSTA Leveraged Loan Index is designed to reflect the performance of the largest facilities in the leveraged loan market.
Key Rates
Key Rates are shown for US Treasurys and London Interbank Offered Rate (LIBOR), the interest rate at which banks offer to lend funds (wholesale money) to one another in the international interbank market. LIBOR is a key benchmark rate that reflects how much it costs banks to borrow from each other. “Current” refers to the percentage rate as of 6/30/2018, while the rates of change are stated in basis points.
Credit Spreads
Credit Spreads shown comprise the Option-Adjusted Spread of the indices indicated, versus the US 10-Year Treasury Yield. “Current” refers to the spread as of 6/30/2018, while the rates of change are stated in basis points.
Key Indicators: Key Indicators correspond to various macro-economic and rate-related data points that we consider impactful to fixed income markets
- 2s10s (bps)/ 10 Yr vs 2 Yr Treasury Spread, which measures the difference between yields on 10-Year Treasury Constant Maturity Securities and 2-Year Treasury Constant Maturity Securities.
- West Texas Intermediate, which is an oil benchmark and the underlying asset in the New York Mercantile Exchange’s oil futures contract.
- Core Consumer Price Index, which measures the consumer price index excluding food and energy prices.
- Breakeven Inflation: 5 Yr %/ bps, which uses 5-Year Treasury Constant Maturity Securities and 5-Year Treasury Inflation–Indexed Constant Maturity Securities to derive expected inflation.
- Breakeven Inflation: 10 Yr %/ bps, which uses 10-Year Treasury Constant Maturity Securities and 10-Year Treasury Inflation–Indexed Constant Maturity Securities to derive expected inflation.
General Disclosure
This document is intended for informational purposes only and should not be otherwise disseminated to other third parties. Past performance or results should not be taken as an indication or guarantee of future performance or results, and no representation or warranty, express or implied is made regarding future performance or results. This document does not constitute an offer to sell, or a solicitation of an offer to purchase, any security, future or other financial instrument or product. This material is proprietary and being provided on a confidential basis, and may not be reproduced, transferred or distributed in any form without prior written permission from WST. WST reserves the right at any time and without notice to change, amend, or cease publication of the information. This material has been prepared solely for informative purposes. The information contained herein includes information that has been obtained from third party sources and has not been independently verified. It is made available on an "as is" basis without warranty and does not represent the performance of any specific investment strategy.
This material is proprietary and being provided on a confidential basis, and may not be reproduced, transferred or distributed in any form without prior written permission from WST. WST reserves the right at any time and without notice to change, amend, or cease publication of the information. This material has been prepared solely for informative purposes. The information contained herein includes information that has been obtained from third party sources and has not been independently verified. It is made available on an "as is" basis without warranty and does not represent the performance of any specific investment .Some of the information enclosed may represent opinions of WST and are subject to change from time to time and do not constitute a recommendation to purchase and sale any security nor to engage in any particular investment strategy. The information contained herein has been obtained from sources believed to be reliable but cannot be guaranteed for accuracy. Past performance is not necessarily indicative of future results. Securities and services are not FDIC or any other government agency insured – Are not bank guaranteed – May lose Value.
Besides attributed information, this material is proprietary and may not be reproduced, transferred or distributed in any form without prior written permission from WST. WST reserves the right at any time and without notice to change, amend, or cease publication of the information. This material has been prepared solely for informative purposes. The information contained herein may include information that has been obtained from third party sources and has not been independently verified. It is made available on an “as is” basis without warranty. This document is intended for clients for informational purposes only and should not be otherwise disseminated to other third parties. Past performance or results should not be taken as an indication or guarantee of future performance or results, and no representation or warranty, express or implied is made regarding future performance or results. This document does not constitute an offer to sell, or a solicitation of an offer to purchase, any security, future or other financial instrument or product.