
January 2022 | Global Equity Markets
January proved a rough start to the year with all major equity benchmarks declining for the month. The S&P 500 return was -5.2% while the S&P Mid Cap 400 and S&P Small Cap 600 were -7.2% and -7.3%, respectively.
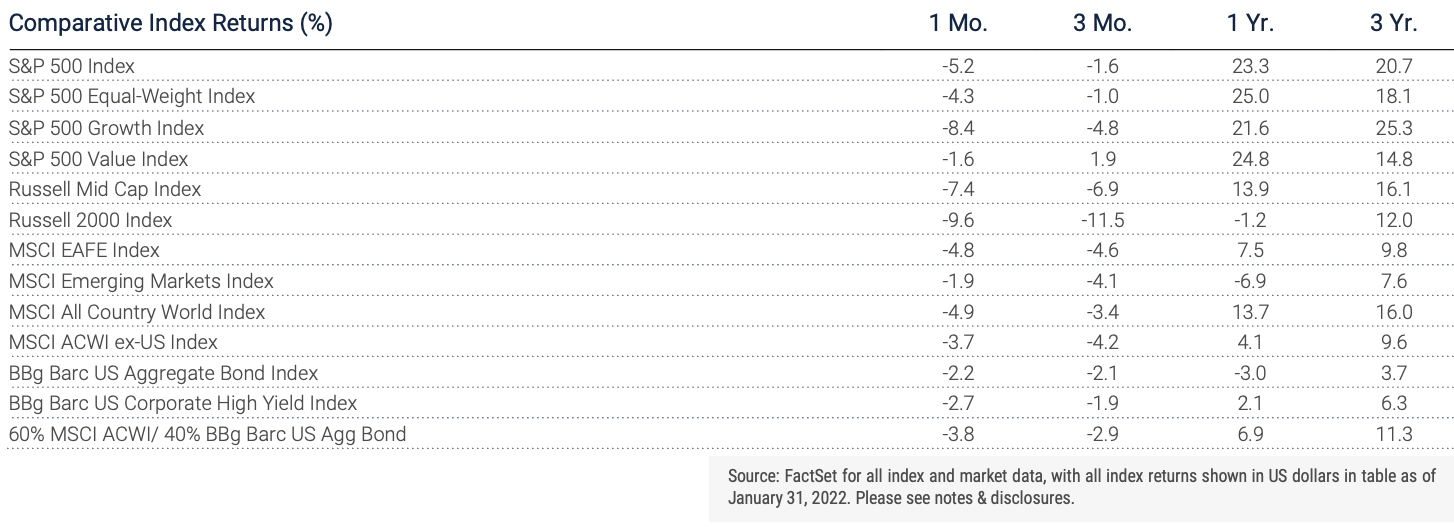
The first month of the year often serves as an indicator of near-term future returns. However, seasonal patterns are loose, and it is worth noting both January 2020 and 2021 were down months in what turned out to be very strong years. An encouraging sign of stability occurred during the last two trading days in January which were the two strongest days of the month. Macro factors were a mixed bag from the perspective of sector returns. Energy was the only sector which generated a positive return last month. Financials, Consumer Staples and Utilities produced smaller losses during the month than the broad market benchmarks while Consumer Discretionary, Technology and Health Care underperformed the indexes. Much more significant was the performance of value over growth where the excess return earned in the less expensive segments of the market was exceptional. Last month was a strong endorsement of the long-term pattern when the market sells off investors eschew future growth for more reasonable valuations and dividends. Three of the strongest months for the value style since 1995 have occurred since February of last year and suggests to us the established leadership of large well known growth companies is being challenged by investors.
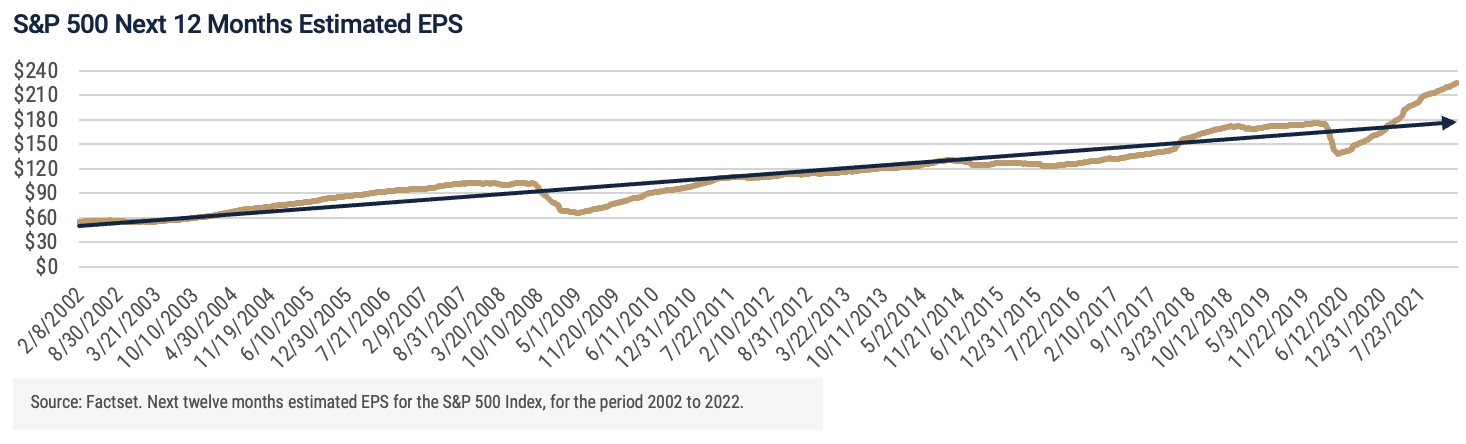
One of the benefits of equity ownership in a period of accelerating inflation is that many companies can pass along rising input cost pressures through higher selling prices. Of course, this advantage is temporary as persistent price increases run the risk of stifling demand as well as encouraging substitution alternatives or new competitors. The grace period for companies keeping pace or even ahead of broad inflation measures appears to be ending. The fourth quarter earnings season currently underway has provided many examples of fewer sales increases being driven by price increases and profit margins rolling over from all time peaks across many industries. In addition, management guidance on prospects being discussed during earnings calls with analysts are clearly being tempered by the cost and availability of labor as well as continued supply disruptions. As the chart below illustrates, estimated earnings per share over the next 12 months is well above the 20-year trendline and suggests the bar is high for raising forecasts during a period of rising costs. The Federal Reserve’s resolve to remove monetary accommodation to combat inflation along with other central banks will likely increase borrowing costs before there is any meaningful reduction in rising prices. This is a challenging environment for the stock market and one which may unnerve many investors. Last year was unusual in that the maximum loss in the S&P 500 during the year was just 5.2% — the eighth smallest intra-year loss in 94 years. The median drawdown in a calendar year has been 12.9% over this period which covers many economic cycles and market environments. While it is difficult to predict what factors may prompt a market decline in any single year, it is useful to know how the market reacts to unforeseen negative events. In other words, history would suggest it is much more likely the intra-year decline in the S&P 500 will exceed 10% than it will be limited to the decline witnessed last year.
Global equity markets followed the U.S. market lower in January but with better results. The S&P Global ex-U.S. index total return was -4.2% in January and compares favorably to the S&P 500 return of -5.2%. Developed major market index leaders include the U.K. (-0.9%), Canada (-1.2%), Spain (-2.0%) and Italy (-3.4%). Emerging markets were standout performers with the S&P Emerging Market Index declining -0.9% in January. Latin American markets were strong after an extended period of lagging returns and major Asian emerging markets also leading many developed market bourses. The dollar rose slightly in January following December’s period of consolidation after strong gains in the May – November period. Recent actions by the Bank of England (2 rate increases) and the walking back of public statements of no increases in 2022 by the European Central Bank has diminished the perception the Federal Reserve had taken the leadership role in a more restrictive monetary policy. If this perspective continues then the dollar may not be the headwind to 2022 international returns for a U.S. investor as it was last year.
Important Notes & Disclosures
Index Returns – all shown in US dollars
All returns shown trailing 1/31/2022 for the period indicated. “YTD” refers to the total return as of prior-year end, while the other returns are annualized. 3-month and annualized returns are shown for:
- The S&P 500 index is comprised of large capitalized companies across many sectors and is generally regarded as representative of US stock market and is provided in this presentation in that regard only.
- The S&P 500® Equal Weight Index (EWI) is the equal-weight version of the widely-used S&P 500. The index includes the same constituents as the capitalization weighted S&P 500, but each company in the S&P 500 EWI is allocated a fixed weight - or 0.2% of the index total at each quarterly rebalance. The S&P 500 equal-weight index (S&P 500 EWI) series imposes equal weights on the index constituents included in the S&P 500 that are classified in the respective GICS® sector.
- The S&P 500 Growth Index is comprised of equities from the S&P 500 that exhibit strong growth characteristics and is weighted by market-capitalization.
- The S&P 500 Value Index is a market-capitalization weighted index comprising of equities from the S&P 500 that exhibit strong value characteristics such as book value to price ratio, cash flow to price ratio, sales to price ratio, and dividend yield.
- The Russell 3000 Index tracks the performance of 3000 U.S. corporations, determined by market-capitalization, and represents 98% of the investable equity market in the United States.
- The Russell Mid Cap Index measures the mid-cap segment performance of the U.S. equity market and is comprised of approximately 800 of the smallest securities based on current index membership and their market capitalization.
- The Russell 2000 Index is a market-capitalization weighted index that measures the performance of 2000 small-cap and mid-cap securities. The index was formulated to give investors an unbiased collection of the smallest tradable equities still meeting exchange listing requirements.
- The MSCI All Country World Index provides a measure of performance for the equity market throughout the world and is a free float-adjusted market capitalization weighted index.
- The MSCI EAFE Index is a market-capitalization weighted index and tracks the performance of small to large-cap equities in developed markets of Europe, Australasia, and the Far East.
- The MSCI Emerging Markets Index is a float-adjusted market-capitalization index that measures equity market performance in global emerging markets and cannot be purchased directly by investors.
- The S&P Global BMI sector indices are into sectors as defined by the widely used Global Industry Classification Standards (GICS) classifications. Each sector index comprises those companies included in the S&P Global BMI that are classified as members of respective GICS® sector. The S&P Global BMI Indices were introduced to provide a comprehensive benchmarking system for global equity investors. The S&P Global BMI is comprised of the S&P Emerging BMI and the S&P Developed BMI. It covers approximately 10,000 companies in 46 countries. To be considered for inclusion in the index, all listed stocks within the constituent country must have a float market capitalization of at least $100 million. For a country to be admitted, it must be politically stable and have legal property rights and procedures, among other criteria.
- The Barclay’s US Aggregate Index, a broad-based unmanaged bond index that is generally considered to be representative of the performance of the investment grade, US dollar-denominated, fixed-rate taxable bond market.
- The Bloomberg Barclay’s US Corporate High Yield Index, which covers the USD-denominated, non-investment grade, fixed-rate, taxable corporate bond market.
An index is a portfolio of specific securities, the performance of which is often used as a benchmark in judging the relative performance to certain asset classes. Index performance used throughout is intended to illustrate historical market trends and performance. Indexes are managed and do not incur investment management fees. An investor is unable to invest in an index. Their performance does not reflect the expenses associated with the management of an actual portfolio. No strategy assures success or protects against loss. There is no guarantee that a diversified portfolio will enhance overall returns or outperform a non-diversified portfolio. Diversification does not protect against market risk. All investing involves risk including loss of principal. Investing in stock includes numerous specific risks including: the fluctuation of dividend, loss of principal, and potential liquidity of the investment in a falling market. Past performance is no guarantee of future results.
Key Indicators
Key Indicators correspond to various macro-economic and rate-related data points that we consider impactful to equity markets.
- The US 10-Year Treasury Yield (%)/bps, is the return on investment for the U.S. government’s 10-year debt obligation and serves as a signal for investor confidence.
- SPDR Gold Trust Price ($), is an investment fund that reflects the performance on the price of a gold bullion, less the Trust’s expenses.
- West Texas Intermediate, which is an oil benchmark and the underlying asset in the New York Mercantile Exchange’s oil futures contract.
- CBOE Volatility Index (Level)/% Change, which uses price options on the S&P 500 to estimate the market's expectation of 30-day volatility.
General Disclosure
Wilbanks, Smith & Thomas Asset Management (WST) is an investment adviser registered under the Investment Advisers Act of 1940. Registration as an investment adviser does not imply any level of skill or training. The information presented in the material is general in nature and is not designed to address your investment objectives, financial situation or particular needs. Prior to making any investment decision, you should assess, or seek advice from a professional regarding whether any particular transaction is relevant or appropriate to your individual circumstances. This material is not intended to replace the advice of a qualified tax advisor, attorney, or accountant. Consultation with the appropriate professional should be done before any financial commitments regarding the issues related to the situation are made.
This document is intended for informational purposes only and should not be otherwise disseminated to other third parties. Past performance or results should not be taken as an indication or guarantee of future performance or results, and no representation or warranty, express or implied is made regarding future performance or results. This document does not constitute an offer to sell, or a solicitation of an offer to purchase, any security, future or other financial instrument or product. This material is proprietary and being provided on a confidential basis, and may not be reproduced, transferred or distributed in any form without prior written permission from WST. WST reserves the right at any time and without notice to change, amend, or cease publication of the information. The information contained herein includes information that has been obtained from third party sources and has not been independently verified. It is made available on an "as is" basis without warranty and does not represent the performance of any specific investment strategy.
Some of the information enclosed may represent opinions of WST and are subject to change from time to time and do not constitute a recommendation to purchase and sale any security nor to engage in any particular investment strategy. The information contained herein has been obtained from sources believed to be reliable but cannot be guaranteed for accuracy.
Besides attributed information, this material is proprietary and may not be reproduced, transferred or distributed in any form without prior written permission from WST. WST reserves the right at any time and without notice to change, amend, or cease publication of the information. This material has been prepared solely for informative purposes. The information contained herein may include information that has been obtained from third party sources and has not been independently verified. It is made available on an “as is” basis without warranty. This document is intended for clients for informational purposes only and should not be otherwise disseminated to other third parties. Past performance or results should not be taken as an indication or guarantee of future performance or results, and no representation or warranty, express or implied is made regarding future performance or results. This document does not constitute an offer to sell, or a solicitation of an offer to purchase, any security, future or other financial instrument or product.