
February 2022 | Global Equity Markets
February continued the trend of falling stocks established in January as the S&P 500 registered a price decline of -3.14%. Interestingly, mid and small sized stock indexes performed better than the large cap S&P 500 with the S&P Mid Cap 400 rising 0.99% and the S&P Small Cap 600 Index adding 1.30%. The S&P 500 falling 3.00% or worse with both mid and small cap benchmarks rising is a rare event and will be discussed in more detail below. Economic sector impacts were a mashup with inflation being the common denominator.
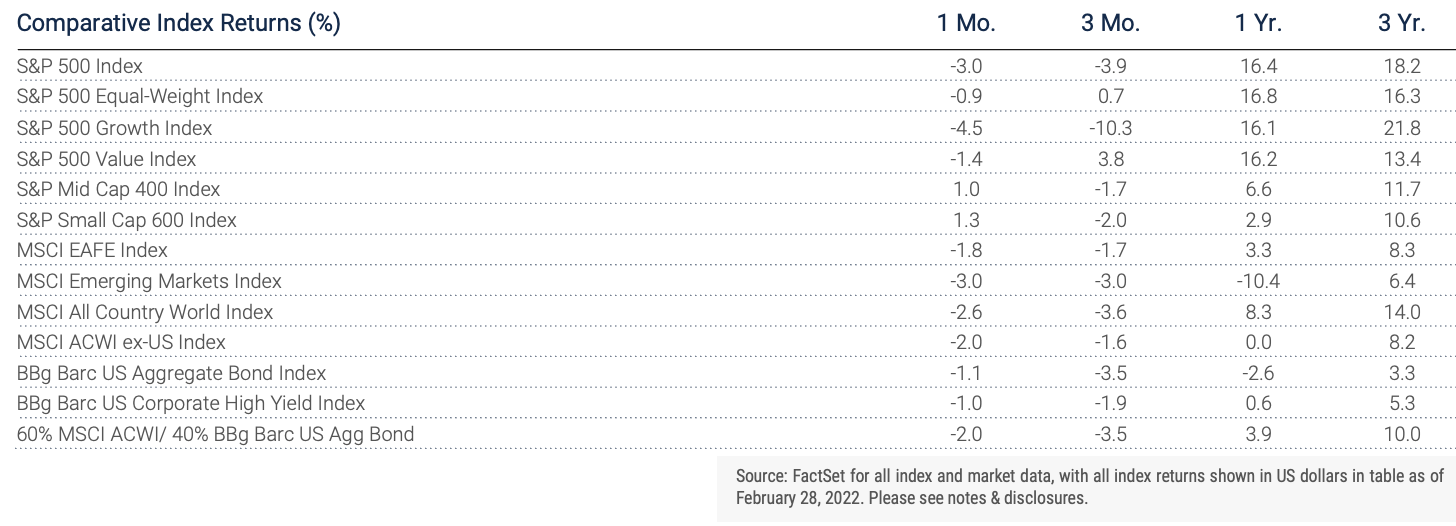
The Energy sector was once again a leader; however, both cyclical and non-cyclical sectors are being adversely impacted by rising logistic, input and wage costs. Value was in the driver’s seat for the third consecutive month and continues a longer-term trend of investors turning back toward valuation and dividend paying companies. Concern regarding inflation and clear geopolitical risks are motivating forces behind a move to lower risk market factors.
While inflation is a worldwide issue, the headline risk as February ended was the Russian invasion of Ukraine. The benefit of global equity diversification was evident as many markets stood up to the Russian invasion of Ukraine better than large cap U.S. stocks. Developed and emerging bourses closest to the conflict understandably fared poorly; however, overall Developed Market ex-U.S. had a February total return of -1.34% with the Asia-Pacific region the strongest at 0.45%. The Emerging market index was down 3.43% with the Latin American region the strongest while Eastern Europe the weakest. The U.S. dollar rose only slightly during the month muting some of the international return. An extended conflict may put some upward pressure in the currency as is often the case when investors seek safety from uncertainty.
Market inflection points are typically accompanied by significant changes in leadership. When the market moves lower investors increase their focus on valuation in the decision process. This shift in behavioral mindset is a rational reaction to a rise in uncertainty and lower confidence in future growth. One recent example is investor preference for dividend paying companies and avoidance of non-dividend paying companies. As of the end of February, companies in the S&P 1500 Composite Index paying dividends were 15% below their 52-week high while those not paying dividends were 26% off their high. Strategies focused on newly public companies which are often losing money at their initial offering have fared even worse with several ETFs buying these companies down 35-50% off their 52-week highs. What was even more unusual was the positive returns in February from the S&P Mid and Small Cap indices while the S&P 500 Large Cap Index fell over 3%. The S&P 500 has declined 3% or worse in 54 of the 326 months since the end of 1994. Mid and small cap indices have historically closely followed the bigger benchmark lower but not last month. February was the first occurrence of the Mid Cap Index having a positive return in a month the S&P 500 fell 3% or worse and only the third occurrence of the Small Cap Index having a positive return over the same period.
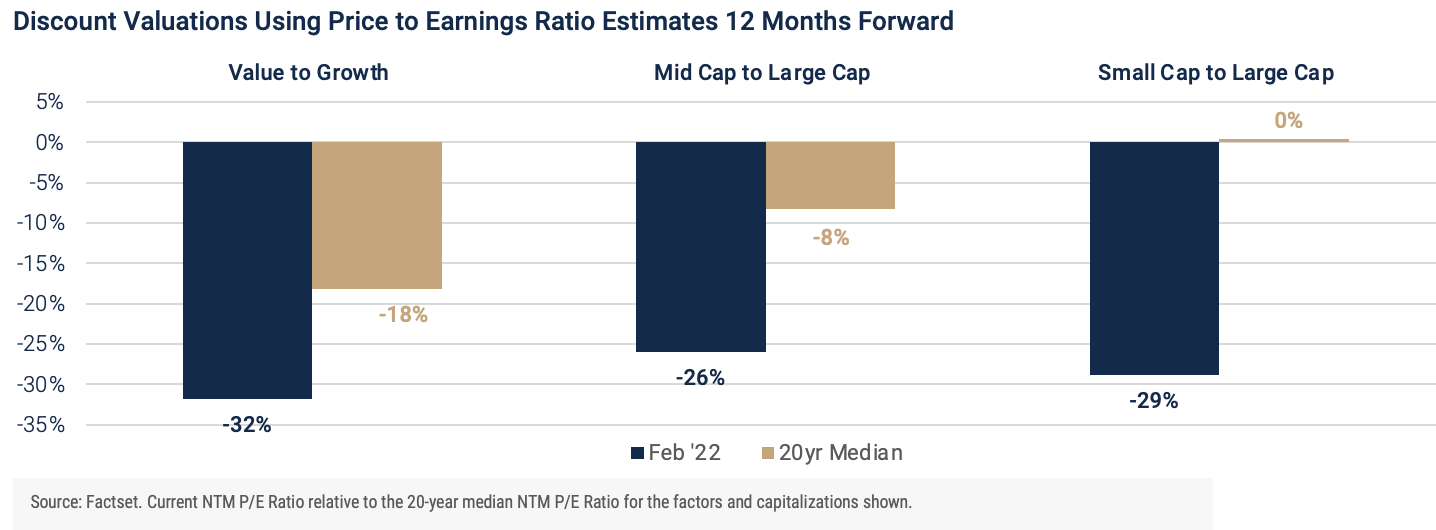
If February turns out to be a major inflection point for the market, there is significant opportunity for an extended shift. The graph above illustrates the valuation gap across the benchmarks discussed above and compares the current valuation to the median of the past twenty years. It is unlikely the move would be a straight line as there are innumerable factors which can change the slope of leadership over shorter periods. Nevertheless, it is worth noting when market volatility increases investors often return to what matters to them most over the long term.
Notes and Disclosures
Index Returns – all shown in US dollars
All returns shown trailing 2/28/2022 for the period indicated. “YTD” refers to the total return as of prior-year end, while the other returns are annualized. 3-month and annualized returns are shown for:
- The S&P 500 index is comprised of large capitalized companies across many sectors and is generally regarded as representative of US stock market and is provided in this presentation in that regard only.
- The S&P 500® Equal Weight Index (EWI) is the equal-weight version of the widely-used S&P 500. The index includes the same constituents as the capitalization weighted S&P 500, but each company in the S&P 500 EWI is allocated a fixed weight - or 0.2% of the index total at each quarterly rebalance. The S&P 500 equal-weight index (S&P 500 EWI) series imposes equal weights on the index constituents included in the S&P 500 that are classified in the respective GICS® sector.
- The S&P 500 Growth Index is comprised of equities from the S&P 500 that exhibit strong growth characteristics and is weighted by market-capitalization.
- The S&P 500 Value Index is a market-capitalization weighted index comprising of equities from the S&P 500 that exhibit strong value characteristics such as book value to price ratio, cash flow to price ratio, sales to price ratio, and dividend yield.
- The Russell 3000 Index tracks the performance of 3000 U.S. corporations, determined by market-capitalization, and represents 98% of the investable equity market in the United States.
- The Russell Mid Cap Index measures the mid-cap segment performance of the U.S. equity market and is comprised of approximately 800 of the smallest securities based on current index membership and their market capitalization.
- The Russell 2000 Index is a market-capitalization weighted index that measures the performance of 2000 small-cap and mid-cap securities. The index was formulated to give investors an unbiased collection of the smallest tradable equities still meeting exchange listing requirements.
- The MSCI All Country World Index provides a measure of performance for the equity market throughout the world and is a free float-adjusted market capitalization weighted index.
- The MSCI EAFE Index is a market-capitalization weighted index and tracks the performance of small to large-cap equities in developed markets of Europe, Australasia, and the Far East.
- The MSCI Emerging Markets Index is a float-adjusted market-capitalization index that measures equity market performance in global emerging markets and cannot be purchased directly by investors.
- The S&P Global BMI sector indices are into sectors as defined by the widely used Global Industry Classification Standards (GICS) classifications. Each sector index comprises those companies included in the S&P Global BMI that are classified as members of respective GICS® sector. The S&P Global BMI Indices were introduced to provide a comprehensive benchmarking system for global equity investors. The S&P Global BMI is comprised of the S&P Emerging BMI and the S&P Developed BMI. It covers approximately 10,000 companies in 46 countries. To be considered for inclusion in the index, all listed stocks within the constituent country must have a float market capitalization of at least $100 million. For a country to be admitted, it must be politically stable and have legal property rights and procedures, among other criteria.
- The Barclay’s US Aggregate Index, a broad-based unmanaged bond index that is generally considered to be representative of the performance of the investment grade, US dollar-denominated, fixed-rate taxable bond market.
- The Bloomberg Barclay’s US Corporate High Yield Index, which covers the USD-denominated, non-investment grade, fixed-rate, taxable corporate bond market.
An index is a portfolio of specific securities, the performance of which is often used as a benchmark in judging the relative performance to certain asset classes. Index performance used throughout is intended to illustrate historical market trends and performance. Indexes are managed and do not incur investment management fees. An investor is unable to invest in an index. Their performance does not reflect the expenses associated with the management of an actual portfolio. No strategy assures success or protects against loss. There is no guarantee that a diversified portfolio will enhance overall returns or outperform a non-diversified portfolio. Diversification does not protect against market risk. All investing involves risk including loss of principal. Investing in stock includes numerous specific risks including: the fluctuation of dividend, loss of principal, and potential liquidity of the investment in a falling market. Past performance is no guarantee of future results.
Key Indicators
Key Indicators correspond to various macro-economic and rate-related data points that we consider impactful to equity markets.
- The US 10-Year Treasury Yield (%)/bps, is the return on investment for the U.S. government’s 10-year debt obligation and serves as a signal for investor confidence.
- SPDR Gold Trust Price ($), is an investment fund that reflects the performance on the price of a gold bullion, less the Trust’s expenses.
- West Texas Intermediate, which is an oil benchmark and the underlying asset in the New York Mercantile Exchange’s oil futures contract.
- CBOE Volatility Index (Level)/% Change, which uses price options on the S&P 500 to estimate the market's expectation of 30-day volatility.
General Disclosure
Wilbanks, Smith & Thomas Asset Management (WST) is an investment adviser registered under the Investment Advisers Act of 1940. Registration as an investment adviser does not imply any level of skill or training. The information presented in the material is general in nature and is not designed to address your investment objectives, financial situation or particular needs. Prior to making any investment decision, you should assess, or seek advice from a professional regarding whether any particular transaction is relevant or appropriate to your individual circumstances. This material is not intended to replace the advice of a qualified tax advisor, attorney, or accountant. Consultation with the appropriate professional should be done before any financial commitments regarding the issues related to the situation are made.
This document is intended for informational purposes only and should not be otherwise disseminated to other third parties. Past performance or results should not be taken as an indication or guarantee of future performance or results, and no representation or warranty, express or implied is made regarding future performance or results. This document does not constitute an offer to sell, or a solicitation of an offer to purchase, any security, future or other financial instrument or product. This material is proprietary and being provided on a confidential basis, and may not be reproduced, transferred or distributed in any form without prior written permission from WST. WST reserves the right at any time and without notice to change, amend, or cease publication of the information. The information contained herein includes information that has been obtained from third party sources and has not been independently verified. It is made available on an "as is" basis without warranty and does not represent the performance of any specific investment strategy.
Some of the information enclosed may represent opinions of WST and are subject to change from time to time and do not constitute a recommendation to purchase and sale any security nor to engage in any particular investment strategy. The information contained herein has been obtained from sources believed to be reliable but cannot be guaranteed for accuracy.
Besides attributed information, this material is proprietary and may not be reproduced, transferred or distributed in any form without prior written permission from WST. WST reserves the right at any time and without notice to change, amend, or cease publication of the information. This material has been prepared solely for informative purposes. The information contained herein may include information that has been obtained from third party sources and has not been independently verified. It is made available on an “as is” basis without warranty. This document is intended for clients for informational purposes only and should not be otherwise disseminated to other third parties. Past performance or results should not be taken as an indication or guarantee of future performance or results, and no representation or warranty, express or implied is made regarding future performance or results. This document does not constitute an offer to sell, or a solicitation of an offer to purchase, any security, future or other financial instrument or product.