
December 2020 | Global Equity Markets Review
World equity markets ended the year on a positive note in December. Investors expressed relief that 2020 concluded and are optimistic about a vaccine for COVID–19 as well as a return to normal economic activity.
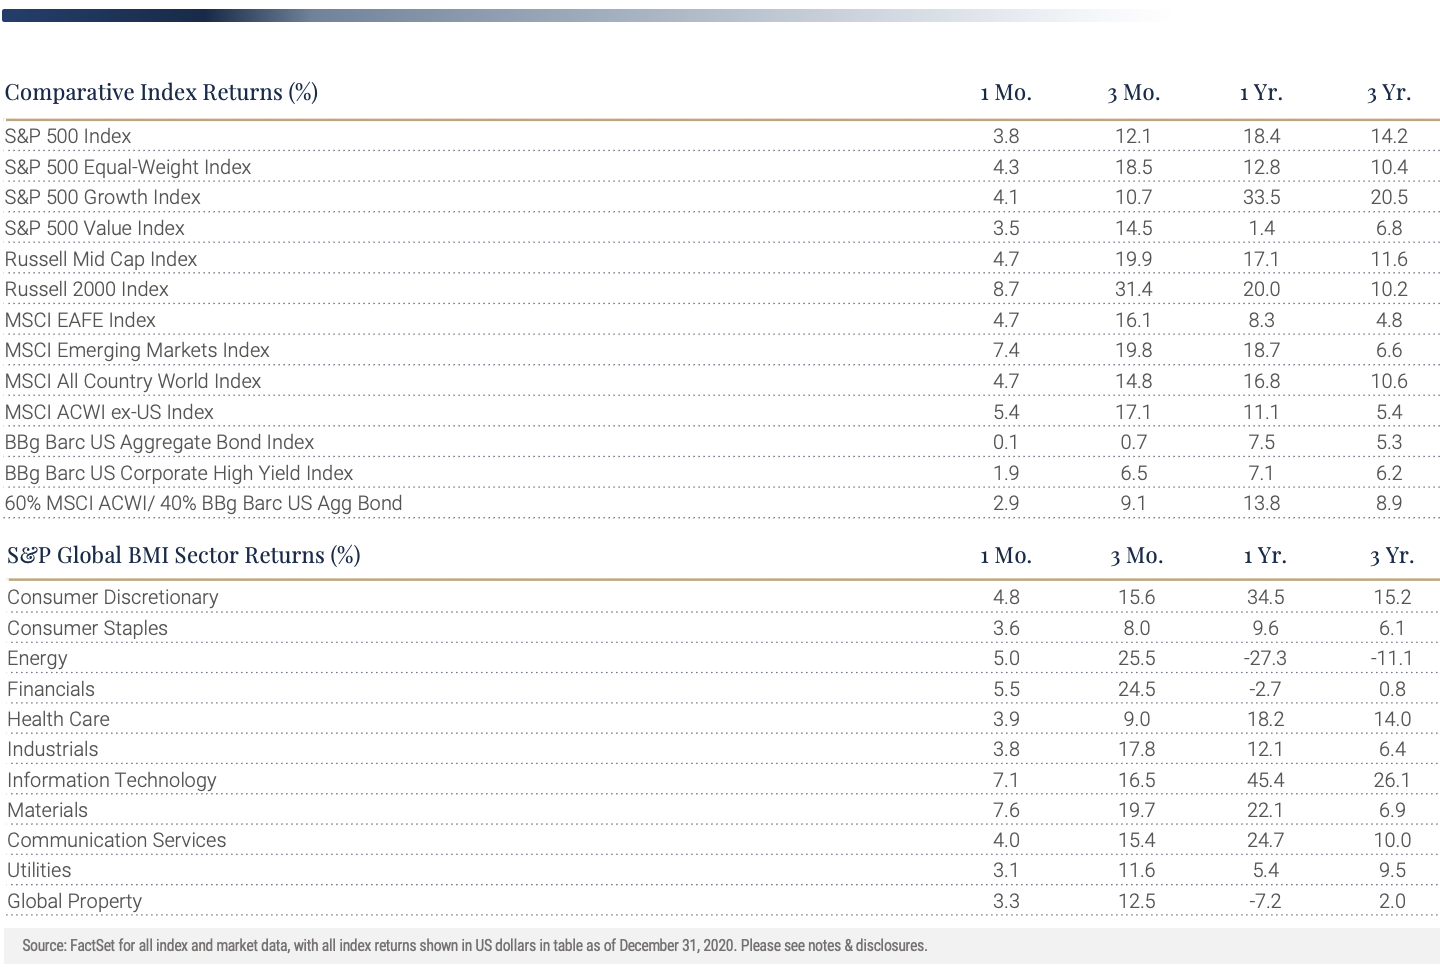
The S&P 500 Index returned 3.84% while the S&P 400 Mid Cap and S&P 600 Small Cap Indexes generated higher returns at 6.52% and 8.32%, respectively. The outperformance of stocks outside the S&P 500 lasted throughout the 4th quarter of 2020 and was the strongest 3-month relative gain in 20 years. We have written in the past about the patience required from more volatile return patterns – including small cap indexes. The long-term return premium has historically been generated from strong bursts of short-term relative strength and is difficult to predict regarding timing. A strategic allocation to this market segment is necessary to capture excess return from a more volatile strategy.
Non-U.S. equity markets, both developed and emerging, outperformed the U.S. in December and finished off a strong quarter of outperformance.
Admittedly, there was a lot of catching up as the U.S. finished the year ahead of most non-U.S. equity markets. Valuation metrics still favor overseas equities which, while rising in recent months, remain at attractive discounts to U.S. stocks. In addition, non-U.S. equity returns were buoyed by a drop in the U.S. dollar in December against most developed and emerging market currencies. A falling dollar aids the return to a U.S. investor and helped both December and full-year returns of non-U.S. equity market results. Dollar volatility has spiked in recent periods and it appears likely to continue in the future. The timing and magnitude of stimulus packages around the world along with differing trajectories of local economies as we emerge from the pandemic lows suggest currency movements will be larger than normal.
Increased optimism is not just about saying “good riddance” to a year that many, if not most of us, would like to forget. Progress on multiple effective vaccines continues to dominate investor decisions and the willingness to take on equity risk. However, this positive mindset should not obscure less favorable news such as the need for more stimulus or the worrying news of a new strain of COVID virus now reaching the U.S. It is also important to note a natural level of optimism by analysts as evidenced by a greater preponderance of negative revisions to earnings earlier than later in a year.
The chart below illustrates the earnings per share in the S&P 500 on both a latest twelve months and a forward twelve months measure. The gap between the two is unusually high and suggests investors expect a quick recovery in the economy and in earnings for companies in the S&P 500. The Index closed the year at 28x and 23x trailing and estimated 12-month earnings respectively — which are both at 20-year highs. One additional point of concern is the dispersion between the most expensive and least expensive 20% of stocks measured by P/E ratios at a 25-year high. This is an unsustainable gap and resolution of the valuation dispersion rarely occurs without downside volatility in the overall index level.
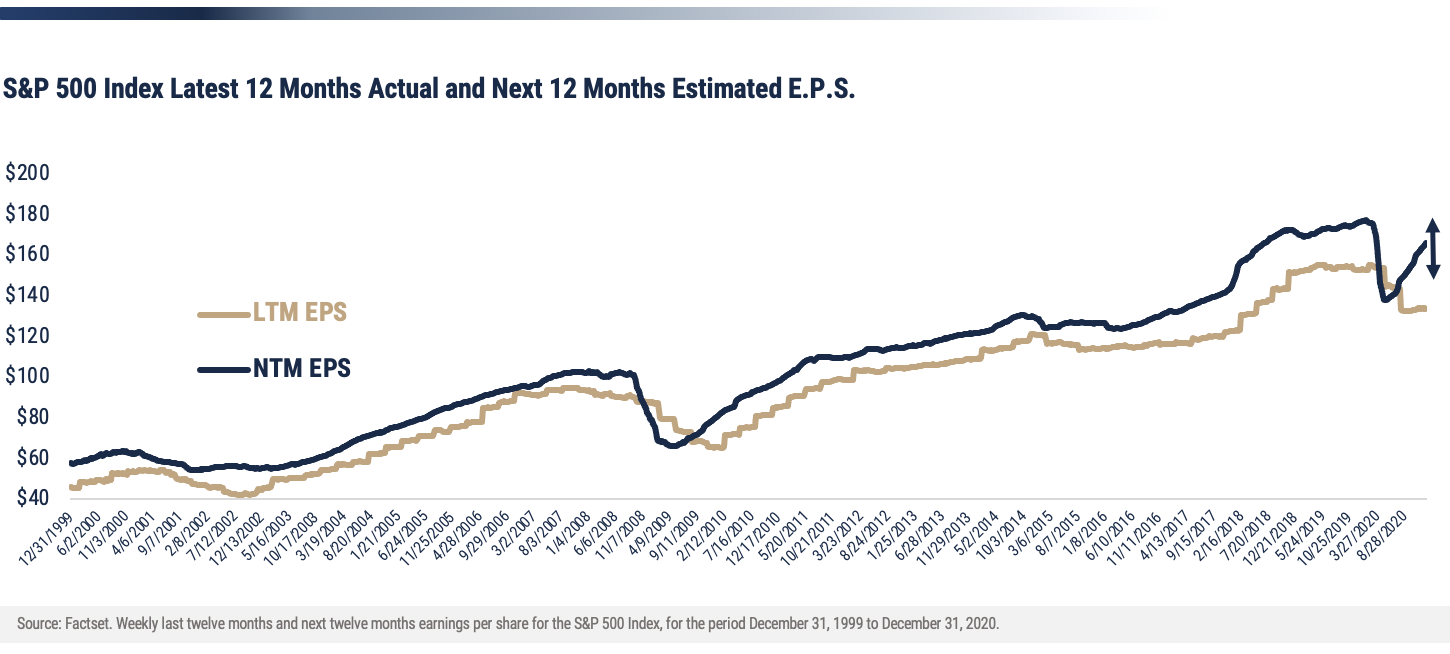
Filling the gap with earnings growth in the quarters ahead and a more normal distribution of valuation between stocks is crucial in supporting current stock prices. Cautious optimism is appropriate in the current environment as the best possible outcome is factored into stock prices while disappointment regarding a return to global health and economic growth is not.
Important Disclosures
Index Returns – all shown in US dollars
All returns shown trailing 12/31/2020 for the period indicated. “YTD” refers to the total return as of prior-year end, while the other returns are annualized. 3-month and annualized returns are shown for:
- The S&P 500 index is comprised of large capitalized companies across many sectors and is generally regarded as representative of US stock market and is provided in this presentation in that regard only.
- The S&P 500® Equal Weight Index (EWI) is the equal-weight version of the widely-used S&P 500. The index includes the same constituents as the capitalization weighted S&P 500, but each company in the S&P 500 EWI is allocated a fixed weight - or 0.2% of the index total at each quarterly rebalance. The S&P 500 equal-weight index (S&P 500 EWI) series imposes equal weights on the index constituents included in the S&P 500 that are classified in the respective GICS® sector.
- The S&P 500 Growth Index is comprised of equities from the S&P 500 that exhibit strong growth characteristics and is weighted by market-capitalization.
- The S&P 500 Value Index is a market-capitalization weighted index comprising of equities from the S&P 500 that exhibit strong value characteristics such as book value to price ratio, cash flow to price ratio, sales to price ratio, and dividend yield.
- The Russell 3000 Index tracks the performance of 3000 U.S. corporations, determined by market-capitalization, and represents 98% of the investable equity market in the United States.
- The Russell Mid Cap Index measures the mid-cap segment performance of the U.S. equity market and is comprised of approximately 800 of the smallest securities based on current index membership and their market capitalization.
- The Russell 2000 Index is a market-capitalization weighted index that measures the performance of 2000 small-cap and mid-cap securities. The index was formulated to give investors an unbiased collection of the smallest tradable equities still meeting exchange listing requirements.
- The MSCI All Country World Index provides a measure of performance for the equity market throughout the world and is a free float-adjusted market capitalization weighted index.
- The MSCI EAFE Index is a market-capitalization weighted index and tracks the performance of small to large-cap equities in developed markets of Europe, Australasia, and the Far East.
- The MSCI Emerging Markets Index is a float-adjusted market-capitalization index that measures equity market performance in global emerging markets and cannot be purchased directly by investors.
- The S&P Global BMI sector indices are into sectors as defined by the widely used Global Industry Classification Standards (GICS) classifications. Each sector index comprises those companies included in the S&P Global BMI that are classified as members of respective GICS® sector. The S&P Global BMI Indices were introduced to provide a comprehensive benchmarking system for global equity investors. The S&P Global BMI is comprised of the S&P Emerging BMI and the S&P Developed BMI. It covers approximately 10,000 companies in 46 countries. To be considered for inclusion in the index, all listed stocks within the constituent country must have a float market capitalization of at least $100 million. For a country to be admitted, it must be politically stable and have legal property rights and procedures, among other criteria.
- The Barclay’s US Aggregate Index, a broad-based unmanaged bond index that is generally considered to be representative of the performance of the investment grade, US dollar-denominated, fixed-rate taxable bond market.
- The Bloomberg Barclay’s US Corporate High Yield Index, which covers the USD-denominated, non-investment grade, fixed-rate, taxable corporate bond market.
An index is a portfolio of specific securities, the performance of which is often used as a benchmark in judging the relative performance to certain asset classes. Index performance used throughout is intended to illustrate historical market trends and performance. Indexes are managed and do not incur investment management fees. An investor is unable to invest in an index. Their performance does not reflect the expenses associated with the management of an actual portfolio. No strategy assures success or protects against loss. There is no guarantee that a diversified portfolio will enhance overall returns or outperform a non-diversified portfolio. Diversification does not protect against market risk. All investing involves risk including loss of principal. Investing in stock includes numerous specific risks including: the fluctuation of dividend, loss of principal, and potential liquidity of the investment in a falling market. Past performance is no guarantee of future results.
Key Indicators
Key Indicators correspond to various macro-economic and rate-related data points that we consider impactful to equity markets.
- The US 10-Year Treasury Yield (%)/bps, is the return on investment for the U.S. government’s 10-year debt obligation and serves as a signal for investor confidence.
- SPDR Gold Trust Price ($), is an investment fund that reflects the performance on the price of a gold bullion, less the Trust’s expenses.
- West Texas Intermediate, which is an oil benchmark and the underlying asset in the New York Mercantile Exchange’s oil futures contract.
- CBOE Volatility Index (Level)/% Change, which uses price options on the S&P 500 to estimate the market's expectation of 30-day volatility.
General Disclosure
Wilbanks Smith & Thomas Asset Management (WST) is an investment adviser registered under the Investment Advisers Act of 1940. Registration as an investment adviser does not imply any level of skill or training. The information presented in the material is general in nature and is not designed to address your investment objectives, financial situation or particular needs. Prior to making any investment decision, you should assess, or seek advice from a professional regarding whether any particular transaction is relevant or appropriate to your individual circumstances. This material is not intended to replace the advice of a qualified tax advisor, attorney, or accountant. Consultation with the appropriate professional should be done before any financial commitments regarding the issues related to the situation are made.
This document is intended for informational purposes only and should not be otherwise disseminated to other third parties. Past performance or results should not be taken as an indication or guarantee of future performance or results, and no representation or warranty, express or implied is made regarding future performance or results. This document does not constitute an offer to sell, or a solicitation of an offer to purchase, any security, future or other financial instrument or product. This material is proprietary and being provided on a confidential basis, and may not be reproduced, transferred or distributed in any form without prior written permission from WST. WST reserves the right at any time and without notice to change, amend, or cease publication of the information. The information contained herein includes information that has been obtained from third party sources and has not been independently verified. It is made available on an "as is" basis without warranty and does not represent the performance of any specific investment strategy.
Some of the information enclosed may represent opinions of WST and are subject to change from time to time and do not constitute a recommendation to purchase and sale any security nor to engage in any particular investment strategy. The information contained herein has been obtained from sources believed to be reliable but cannot be guaranteed for accuracy.
Besides attributed information, this material is proprietary and may not be reproduced, transferred or distributed in any form without prior written permission from WST. WST reserves the right at any time and without notice to change, amend, or cease publication of the information. This material has been prepared solely for informative purposes. The information contained herein may include information that has been obtained from third party sources and has not been independently verified. It is made available on an “as is” basis without warranty. This document is intended for clients for informational purposes only and should not be otherwise disseminated to other third parties. Past performance or results should not be taken as an indication or guarantee of future performance or results, and no representation or warranty, express or implied is made regarding future performance or results. This document does not constitute an offer to sell, or a solicitation of an offer to purchase, any security, future or other financial instrument or product.