
WST Commentary: 3Q 2019 Markets & Economic Update
"Business can flourish with tariffs, business can flourish without tariffs, but business cannot flourish where there is uncertainty." - Stanley Baldwin, UK Prime Minister, 1923
"I guess I should warn you, if I turn out to be particularly clear you've probably misunderstood what I've said.” - Alan Greenspan, Former Fed Chairman
Market activity in the third quarter reflected increasing concern about slowing global growth, rising U.S.-China trade tensions and uncertain central bank policy. Day-to-day volatility marked the response of equity investors to headlines, creating a busy trading environment but landing global stock prices only modestly higher than the levels observed at the start of 3Q.
Bond investors were more decisive and yields declined sharply during the quarter, even after a short technical correction in September. Whereas a year ago the global economy looked to be in good shape - with both business and consumer confidence solid, labor markets robust, and inflation edging healthily higher - these critical metrics softened during the summer and early fall. The global economy decelerated faster than expected as the slump in trade and manufacturing dampened corporate profits along with job growth and business investment. With the longest-ever economic expansion at risk central banks responded as expected to the deteriorating trends. The U.S. Federal Reserve (“the Fed”) lowered the discount rate in July and September and the European Central Bank (“the ECB”) drove rates further into negative territory while also hitting restart on quantitative easing. The case for lower rates is clear as recession fears intensify and inflation remains persistently low, but economists worry that global central bank policy has evolved from data-dependent and evidence-based to increasingly preoccupied with expectations for ever-lower rates. The axiom that lower interest rates always stimulate economic growth may no longer hold true. Interest rates have trended broadly lower for 40 years, but we are in uncharted territory now as a substantial share of the global bond market is priced with negative yields.
Given today's dynamic environment the range of possible outcomes for the markets is wide and bounded by two main scenarios. Under what Robeco calls the “Reboot of Globalization”[1] scenario, the trade situation stabilizes and politicians negotiate a détente that averts the worst-case outcomes for the global economy. Under this scenario the next recession, whenever it occurs, is relatively short and benign; interest rates rise modestly and equity markets see cyclicality but no major disruption. A more challenging environment, coined “Echoes of the 1970’s” is possible if the breakdown in international relations accelerates or is exacerbated by a hard Brexit or other geopolitical disruption. Under this scenario the battle for global hegemony between the U.S. and China lays waste to the world economy, reversing decades of progress on globalization. With central banks already extended and essentially out of policy ammunition, policymakers have few options. So begins a harsh cycle of falling profits, declining investment and rising unemployment. Under that grim scenario yields remain depressed or fall further and stocks correct sharply.
With uncertainty high and challenges mounting we see the possibility of larger-than-normal market swings in coming months. Downside risk seems to outweigh upside potential, and we remain focused on building a well-diversified mix of assets to match the time horizon, risk and return objectives of each of our clients. For some clients that means rebalancing to target allocations after a very strong run for stocks. For others it means shifting some exposure to segments of the portfolio with higher expected returns.
Economic Overview
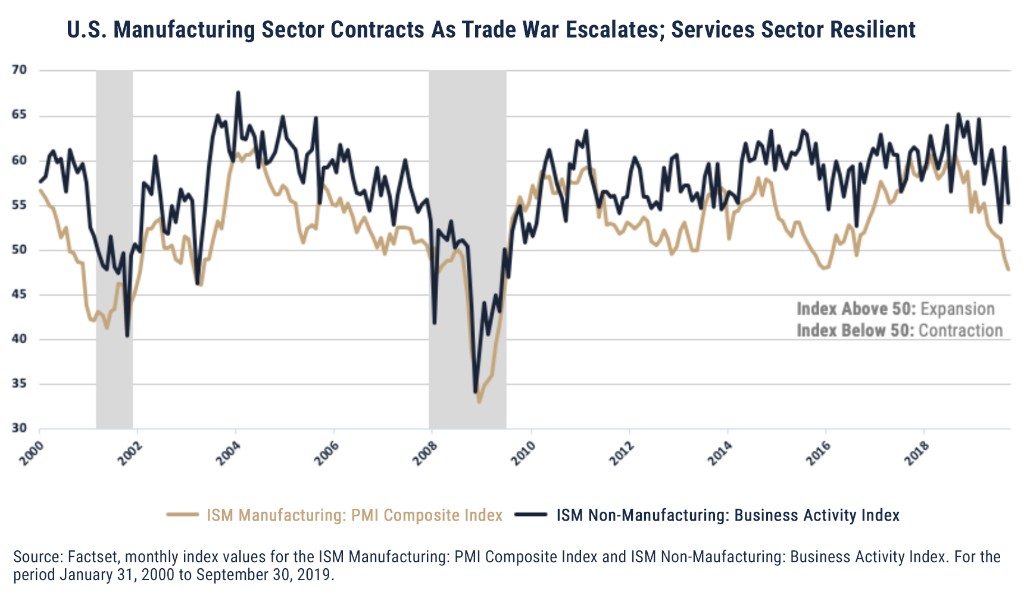
The global economy continued to weaken in the third quarter as monetary easing failed to offset the toll of the trade war on business confidence. Manufacturing has been particularly hard-hit - especially in export-sensitive economies such as China and Europe - and business investment and capital spending have likewise faltered. The end of the quarter saw an acceleration in the decline in U.S. manufacturing activity. The ISM Manufacturing Index, which is based on a survey of purchasing managers at 300 firms, fell 2.2 percentage points in September, indicating for the U.S. manufacturing segment the second consecutive month of outright contraction - not simply slower growth. Survey respondents pointed to “signs of a broad slowdown taking hold.” The services sector, which is driven by consumer confidence, has held up better than manufacturing this year but also reflected these headwinds. The ISM Non-Manufacturing index registered 52.6 in September (a figure above 50 signals expansion, below 50 means contraction) but that figure is down 3.8 percentage points from the August reading of 56.4. Weakness in the commercial and industrial segments of the economy seems bound to spread eventually to personal consumption, and these indicators will be important to watch in coming months. At least for now the U.S. economy remains steady, primarily because of the robust consumer segment. Consumer confidence remains high after unemployment hit a 50-year low in September and personal income came in 4% higher year over year. Those confident consumers are enjoying the fruits of their labor; consumer spending also rose at a 4% annualized pace.
The rest of the global economy unfortunately appears unable to match the resilience of the U.S. Eurozone growth is feeble at best, with Germany and Italy on the verge of recession. Uncertainty around seemingly endless Brexit negotiations drove a contraction of the UK economy in the second quarter, and that trend likely continued in the third. Emerging market and less-developed, export-heavy economies - particularly China, Taiwan and Korea - are among the hardest hit by the trade war. As we discuss below global central banks embarked on a fresh round of policy easing in the third quarter in an attempt to mitigate the impact of the trade war, but with interest rates already at or below zero in much of the world the effectiveness of monetary policy is in doubt. In a controversial move the ECB also restarted its quantitative easing program, beginning with monthly purchases of $20 billion in government bonds in November. Given the uncertainty surrounding the efficacy of monetary policy the clear best outcome for the global economy would be a trade deal that allows central banks to remain on the sideline rather than a no-deal scenario that leaves government intervention the only solution.
The direction of U.S. trade talks with China will be the most important swing factor affecting the economy and markets in the next year. If the conflict escalates it could easily trigger a recession, while on the other hand a trade deal that mitigates the tariffs already in place and heads off the expected additional tariff increases could support a re-acceleration of growth and extend the global expansion into 2020 and beyond. While expectations are limited for a comprehensive trade deal, any negotiation that removes uncertainty will be positive for sentiment. De-escalation is the best path for both sides, but politics make the course of trade talks hard to predict. As Barron’s points out, China, “the 800-pound panda” in any conversation about the global economy, is the most-mentioned source of concern among corporate managers,[2] and as we detailed last quarter it would be difficult to overemphasize the importance of China to the health of the world economy. Global GDP is expected to grow 3.3% this year with over a third of that growth projected to come from China and another third driven by other emerging market economies tied closely to China. Last year China’s official growth tally came in at 6.6%, the lowest rate since 1990, and while Premier Li Keqiang recently reiterated the official growth target range of 6% to 6.5% this year, he noted that it would “not be very easy” for China’s economy to grow faster than 6% this year. China’s massive government debts limit its ability to print more money to stimulate growth, and economic issues are complicated by the pro-democracy protests in Hong Kong. The complexity of the U.S./China relationship was drawn into focus in early October by the flap over a tweet put out by a National Basketball Association official in support of those protests. The drama that followed highlights the challenges the U.S. faces in managing our economic and political ties with China.
As we enter the fourth quarter economists are struggling to reconcile the positive indicators (strong labor markets, solid corporate balance sheets and earnings and robust equity markets) with the warnings flashing from shrinking global trade, weak manufacturing data and the very recent softness in the services sector. The most obvious demonstration of the gap between the near-term data and the longer-term cyclical outlook is the yield curve.
Bond Market Overview - The Interest Rate Puzzle
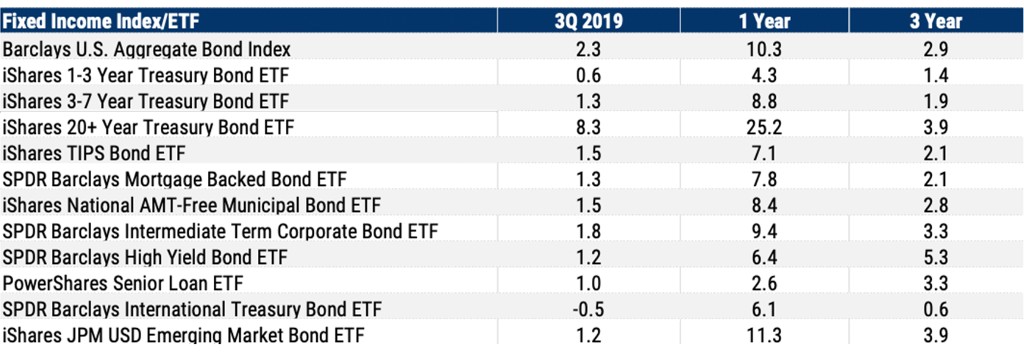
The big story for bonds over the past year is the collapse in global interest rates and the inversion of the yield curve. Interest rates declined again during the third quarter and the U.S. Treasury curve flattened further, extending the robust rally in fixed income securities. The Barclays U.S. Aggregate Bond Index rose 2.3% for the quarter, bringing the year-to-date return to 8.5% and the one-year return to 10.3%. Long bonds outperformed all others again due to the flattening curve and the multiplier effect of long duration. The iShares 20+ year Treasury Bond ETF, representative of the long end of the government bond curve, rose 8.3% in the third quarter, bringing its one-year return to 25.2%. Corporate bonds also performed well, demonstrating resilience to the slowing economy, and yield spreads were roughly unchanged for both the investment-grade and high-yield markets. Municipal bonds’ ten-month run of positive performance ended in September as new issuance accelerated, adding supply to the market, but year-to-date and one-year returns remain strong.
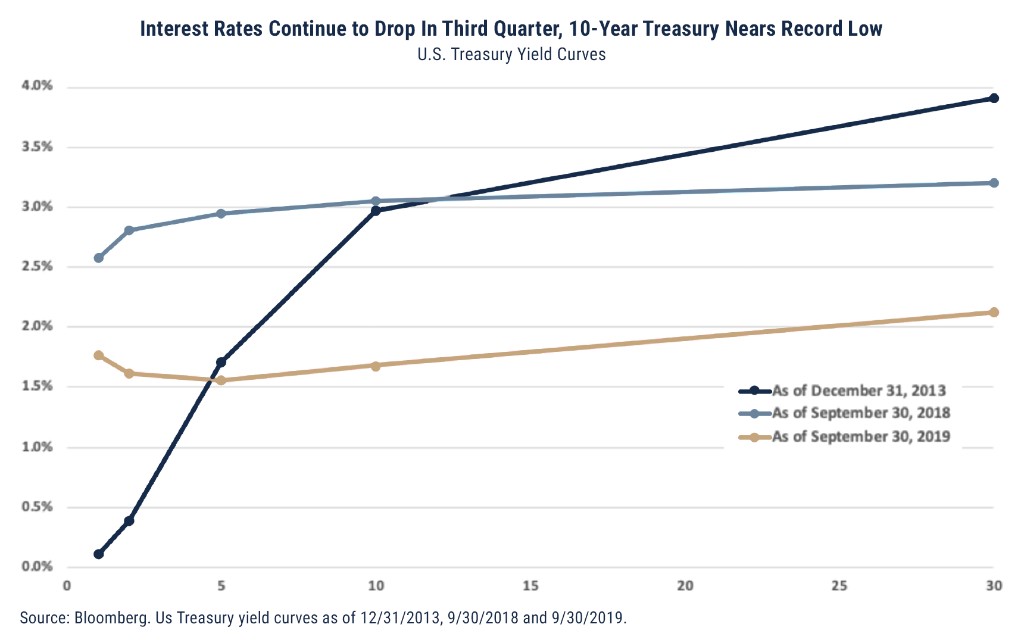
The yield on the 10-year Treasury note peaked at 3.23% in October 2018, its highest level since 2011, but has fallen under 1.5% as we write this letter a year later. The chart below reveals the magnitude of the drop in yields across all maturities. The implications of that broad decline are important. We've written in the past about the disconnect between the stock and bond markets, and despite occasionally fitful performance global equities are still trading close to all-time highs, suggesting continued investor optimism about the outlook for global growth and corporate earnings. Bond investors take a different view, as revealed by their willingness to accept meager and even negative returns in pursuit of capital preservation. In August the spread between the 2- and 10- year government bonds went negative for the first time since 2007, and while the circumstances in each case are unique recessions have generally followed inversions within two years.
As we enter the fourth quarter most investors are rooting for continued rate cuts, which traditionally support the economy and markets by reducing borrowing costs and increasing the relative attractiveness of dividends and earnings. The story may not be so simple this time. In previous downturns policymakers had room to cut the Fed funds rate by about 500 basis points on average over the course of an easing cycle, a buffer that gave markets confidence and patience that, over time, abundant liquidity and cheap borrowing costs would encourage economic risk-taking and consumption. After cutting rates to zero during the Great Financial Crisis the Fed tried to restock its arsenal with nine 25 basis-point increases beginning in 2015, but was forced to halt in December 2018 - with the policy level only back to 2.25% to 2.5% - as the global economy shuddered. Now, following rate cuts in July and September, the benchmark rate is back down to 1.75% to 2% with another 25-basis point cut expected in late October. The Fed's policy margin is slim; with economic growth tenuous despite rates below 2% the outlook for the U.S. economy is worrisome.[3] Ultra-low interest rates actually create headwinds for the economy in some cases. Low bond yields exacerbate the challenges facing pension plans because lower returns result in higher funding requirements, so municipalities, states and companies must divert money that could have otherwise been invested productively to shore up their pension balances. The Fed estimates that, even factoring in an optimistic 7.25% return assumption, unfunded liabilities for U.S. pensions total over $6 trillion. In a worst-case scenario continued low yields coupled with an equity market correction could trigger the long-feared pension crisis. Low rates also mean less earnings and disposable income for retirees, an investment demographic that invests significantly in bonds. The flipside of that equation is that meager yields on bonds have driven many individual and institutional investors to allocate more assets to riskier assets including stocks - another trend that could exacerbate the next market downturn.
Bond markets outside of the U.S. are even more interesting and challenging. With over $15 trillion in bonds priced at negative yields, the global interest rate market is anticipating a recession. Negative interest rate policies, where governments set rates below zero, have been introduced in Europe and Japan to stimulate demand, but so far the experiment with negative rates has not worked well and in fact has produced some unintended consequences. The conventional wisdom that lower interest rates always stimulate growth failed to factor in the psychological toll that negative rates have had on confidence. Gilliam Tett suggests in the Financial Times that negative rates send confusing signals to investors who fear that a central bank embarking on such a radical experiment must be operating in panic mode. When the Bank of Japan unleashed negative rates to combat deflation, that policy shift had little effect on consumer or corporate spending. In the Eurozone, where the ECB dropped rates further into negative territory last quarter, the action has simply fueled fears that something is “deeply and permanently wrong with the economy.”[4] It appears that rather than encouraging consumption, lower and especially negative yields have encouraged more saving as families and institutions hoard cash and reduce their expectations for returns.
Equity Market Overview
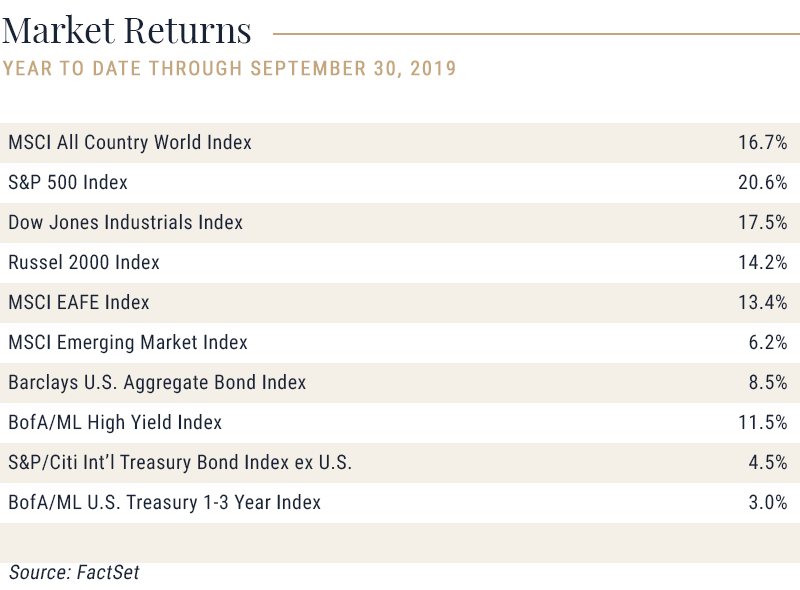
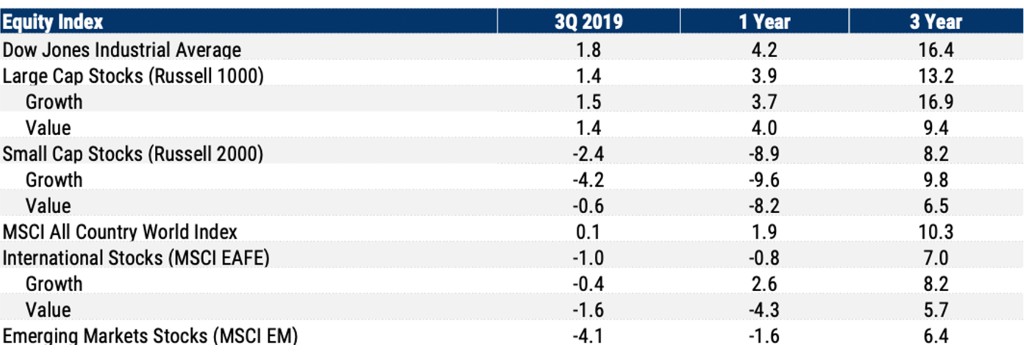
Amid this challenging backdrop stocks took a breather in the third quarter, with the MSCI All Country World Index providing a return of just 0.1% since June 30. Large-cap domestic stocks were up 1.4% while U.S. small-cap growth stocks declined 4.2%. The weakness in small-cap growth shares is attributable to both their sensitivity to the economy and the floundering IPO market, which reveals a disconnect between private and public market valuations. Nearly half of all companies taken public in 2019 are trading below their public offering prices, with the highest-profile examples being Uber and Lyft. Those two ride-sharing giants had a combined private valuation of $90 billion prior to their IPOs but now have a combined public market valuation of just $55 billion. With less than a quarter of the constituent companies expected to achieve profitability by the end of 2020, 2019's IPO class is the least profitable since the tech bubble, according to Markets Insiders’ Ben Wick. The narrative around the money-losing platform companies may be falling apart as the macro picture weakens and investors focus on valuations.[5]
Looking forward into the remainder of this year and into 2020, we see investors continuing to wrestle with the complicated dynamic of healthy but slowing growth, low interest rates and the unpredictable trade situation. For now the “TINA” trade continues, meaning "There Is No Alternative" to equities in today's ultra-low interest rate environment. With no immediate catalyst to drive interest rates higher and the universe of bonds offering negative yields continuing to grow, equities could remain the asset class of choice for some time. The risk embedded in the “TINA” trade however is that low interest rates and especially today's inverted yield curve are predicting a cyclical slowdown which, when it occurs, will eventually impact corporate earnings.
With stocks moving mostly sideways in the quarter the longer-term relative performance trends that we outlined in July are unchanged. The core of our equity portfolios remain broadly diversified in U.S. equities across the market capitalization spectrum, complemented by allocations to both developed and emerging markets stocks outside of the U.S. Given the sustained, significant outperformance of domestic over international stocks over the current market cycle, we often find ourselves reviewing with clients and investment committees the “why?” behind our international equity allocation.
Three tenents comprise the rationale for including non-U.S. equities in portfolios today. The first is diversification. The U.S. economy accounts for only 25% of global GDP and the U.S. stock market accounts for just 55% of the global stock market capitalization. Despite – or perhaps given - investors’ natural bias in favor of their home markets, the diversification benefit of investing globally is significant. Closely related is the second foundation of global diversification: exposure to higher economic growth rates. Even today as global growth slows, many parts of the world including China and other emerging markets continue to enjoy economic growth faster than that observed or predicted in the U.S. Finally, valuations are much more attractive overseas due to the exact performance dynamic that has frustrated globally diversified equity investors. As the following chart details, the All Country World Index ex-U.S., an index that captures the universe of stocks traded outside of the United States, trades at a 20% discount to the S&P 500 in absolute terms and is inexpensive relative to its long-term valuations. U.S. stocks, meanwhile, are moderately expensive relative to historical valuations.
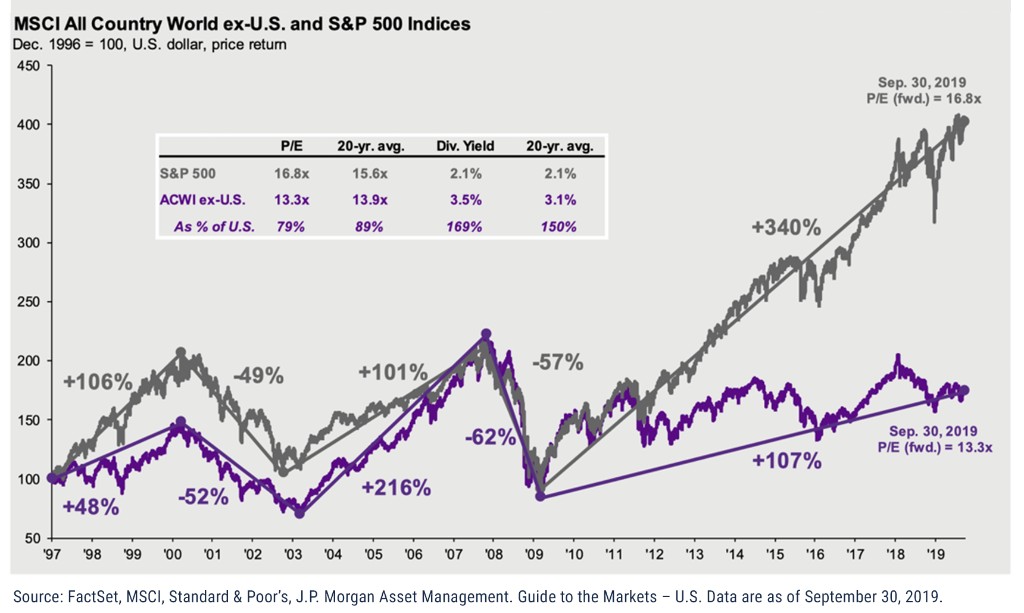
Maintaining geographic diversification requires patience after the long cycle of U.S. outperformance, but history reveals that patience is rewarded when relative performance reverses. We continue to await the inflection point at which the growth characteristics and inexpensive valuations of non-U.S. equities trigger the next cycle of outperformance by foreign stocks.
Summary
Given the economic and political cross currents driving the markets today the lack of a strong consensus on the outlook is understandable. Maintaining discipline and staying focused on long-term objectives or among the keys to successful investing, but sometimes it is difficult to ignore the noise. Over the course of recent weeks the headlines in the Wall Street Journal have provided an eye-opening and sometimes entertaining glimpse at the markets’ short-term focus. Each of the following was a headline in the WSJ paper edition or website. Notice how quickly the outlook changes, sometimes over the course of a single day. Case closed on the value of market timing based upon news headlines!
- October 3 - Stocks Are Off to Ominous Start In 4Q
- October 4 - Stocks Rally After Jobs Report
- October 8 - Stocks Fall On Trade Worries
- October 9 - Stocks Climb On Trade Optimism
- October 9 - (late update) – Stocks Dive As Trade Hopes Fade
- October 10 – Stocks Climb On Trump’s Plan To Meet With Chinese Negotiator
As we’ve discussed, and setting aside the daily news, we do see important transitions under way. With the global economy more fragile and growth less certain, we are more focused than usual on portfolio risk. Incoming International Monetary Fund President Kristalina Georginva warned in her opening remarks to the IMF board that the world's ability to "mobilize a swift collective response to the threats the world faces today" is in doubt due to the limitations of monetary policy, and negative interest rates are a conundrum no policy maker has ever faced.
Important Disclosures:
This report was prepared by Wilbanks Smith and Thomas, a federally registered investment adviser under the Investment Advisers Act of 1940. Registration as an investment adviser does not imply a certain level of skill or training. The oral and written communications of an adviser provide you with information about which you determine to hire or retain an adviser. This is prepared for informational purposes only. It does not address specific investment objectives nor is the content intended as an offer or solicitation for the purchase or sale of any security.
Unless otherwise indicated, performance information for indices, funds and securities as well as various economic data points are sourced from FactSet as of September 30, 2019. This newsletter represents opinions of Wilbanks, Smith and Thomas Asset Management, LLC that are subject to change and do not constitute a recommendation to purchase or sell any security nor to engage in any particular investment strategy. The information contained herein has been obtained from sources believed to be reliable but cannot be guaranteed for accuracy. This material is proprietary and being provided on a confidential basis, and may not be reproduced, transferred or distributed in any form without prior written permission from WST. WST reserves the right at any time and without notice to change, amend, or cease publication of the information. This material has been prepared solely for informative purposes. It is made available on an "as-is" basis without warranty. There are no guarantees investment objectives will be met.
This newsletter represents opinions of Wilbanks, Smith and Thomas Asset Management, LLC and are subject to change from time to time, and do not constitute a recommendation to purchase or sell any security nor to engage in any particular investment strategy. This material is proprietary and being provided on a confidential basis, and may not be reproduced, transferred or distributed in any form without prior written permission from WST. WST reserves the right at any time and without notice to change, amend, or cease publication of the information. This material has been prepared solely for informative purposes. The information contained herein includes information that has been obtained from third party sources and has not been independently verified. It is made available on an "as is" basis without warranty. There are no guarantees investment objectives will be met.
The information contained herein has been obtained from sources believed to be reliable but cannot be guaranteed for accuracy.
Market indices are unmanaged and do not reflect the deduction of fees or expenses. You cannot invest directly in an index such as these and the performance of an index does not represent the performance of any specific investment strategy. We consider an index to be a portfolio of securities whose composition and proportions are derived from a rules-based model. Market indices are unmanaged and do not reflect the deduction of fees or expenses. You cannot invest directly in an index such as these and the performance of an index does not represent the performance of any specific investment strategy.
The S&P 500 Index is a market capitalization weighted index, including reinvestment of dividends and capital gains distributions that is generally considered representative of U.S. stock market. The Dow Jones Industrial Average (DJIA) is a price-weighted average of 30 significant stocks traded on the New York Stock Exchange (NYSE) and the NASDAQ. The MSCI ACWI Index is a free float-adjusted market capitalization weighted index that is designed to measure the equity market performance of developed and emerging markets. The MSCI ACWI ex USA Index is designed to provide a broad measure of stock performance throughout the world, with the exception of U.S.-based companies. The MSCI EAFE Index is a stock market index that is designed to measure the equity market performance of developed markets outside of the U.S. & Canada. It is maintained by MSCI Barra, a provider of investment decision support tools; the EAFE acronym stands for Europe, Australasia and Far East. The MSCI Emerging Markets Index captures large and mid cap representation across 24 Emerging Markets (EM) countries. With 845 constituents, the index covers approximately 85% of the free float-adjusted market capitalization in each country. The Russell 1000 Index is an index of approximately 1,000 of the largest companies in the U.S. equity market. The Russell 1000 is a subset of the Russell 3000 Index. It represents the top companies by market capitalization. The Russell 1000 typically comprises approximately 90% of the total market capitalization of all listed U.S. stocks. The Russell 2000 index measures the performance of the 2,000 smallest companies in the Russell 3000 index. The Bloomberg Barclays U.S. Aggregate Bond Index covers the USD-denominated, investment-grade, fixed-rate, taxable bond market of SEC-registered securities. The index includes bonds from the Treasury, Government-Related, Corporate, MBS, ABS, and CMBS sectors. The BofA Merrill Lynch U.S. High Yield Index tracks the performance of U.S. dollar denominated below investment grade corporate debt publicly issued in the U.S. domestic market. Qualifying securities must have a below investment grade rating (based on an average of Moody’s, S&P and Fitch), at least 18 months to final maturity at the time of issuance, at least one year remaining term to final maturity as of the rebalancing date, a fixed coupon schedule and a minimum amount outstanding of $250 million. The BofA Merrill Lynch 1-3 U.S. Year Treasury Index is an unmanaged index that tracks the performance of the direct sovereign debt of the U.S. Government having a maturity of at least one year and less than three years. The S&P/Citigroup International Treasury Bond ex-U.S. Index measures the performance of treasury bonds, with maturities greater than or equal to one year, issued by non-U.S. developed market countries.
[1] Escaping the Hall of Mirrors, Robeco, October 2019, www.robeco.com/expectedreturns.
[2] Kapadia, Reshma, A World Beyond China, Barron’s, October 7, 2019.
[3] The High Risk of Low Rates, IBD Weekly, October 7, 2019.
[4] Tett, Gilliam, The Downside of Negative Interest Rates, Financial Times, October 9, 2019.
[5] https://markets.businessinsider.com/news/stocks/ipo-market-outlook-trends-why-investors-rebelling-against-unicorns-implications-2019-9-1028570687#reason-1-weak-margins1
Besides attributed information, this material is proprietary and may not be reproduced, transferred or distributed in any form without prior written permission from WST. WST reserves the right at any time and without notice to change, amend, or cease publication of the information. This material has been prepared solely for informative purposes. The information contained herein may include information that has been obtained from third party sources and has not been independently verified. It is made available on an “as is” basis without warranty. This document is intended for clients for informational purposes only and should not be otherwise disseminated to other third parties. Past performance or results should not be taken as an indication or guarantee of future performance or results, and no representation or warranty, express or implied is made regarding future performance or results. This document does not constitute an offer to sell, or a solicitation of an offer to purchase, any security, future or other financial instrument or product.