Revisiting Risk in an Euphoric Market Environment
 Every investor with experience in the stock market should understand there is a relationship between return and risk. The existence of a trade-off between the opportunities for gain against the possibility of loss is not in debate. Nor are the mathematical calculations behind each side of the equation subject to argument. However, where investors do take sides is what the definition of risk really means. There are three definitions of risk broadly categorized as:
- The risk of absolute loss
- Volatility of short term returns
- Opportunity loss
THE RISK OF ABSOLUTE LOSS is straightforward but nevertheless deserves some commentary. Stock certificates have no maturity date, so theoretically can be held indefinitely. The risk of absolute loss is not defined as a capitulation by investors who sell stock in a company still operating after a dramatic drop in the price. The risk of absolute loss (i.e. 100%) in a failed company represents a very small percentage of public companies over history.
VOLATILITY OF SHORT-TERM RETURNS is a much broader definition of risk and generally the most accepted view by investors. There are two sides to volatility of returns however; there is upside volatility (which is the kind investors want) and downside volatility (which most investors don’t want). The emotional reaction by investors to downside volatility is very real, as it may force selling stocks in a down market as the shift to preserving capital becomes paramount.
OPPORTUNITY LOSS is the subject of this letter and is defined as the risk of being out of an asset class that performs well over a long period of time. Opportunity loss is inversely correlated to the time horizon of investors as the shorter the time horizon of an investor the greater the risk of a lost opportunity.
Edison concisely makes the point. For example, the best time to raise exposure to the stock market is when the most number of investors believe the opposite (i.e. the market dressed in overalls). For investors, the metaphor of work Edison expressed can be translated into the patience required the greater the volatility in the asset class.
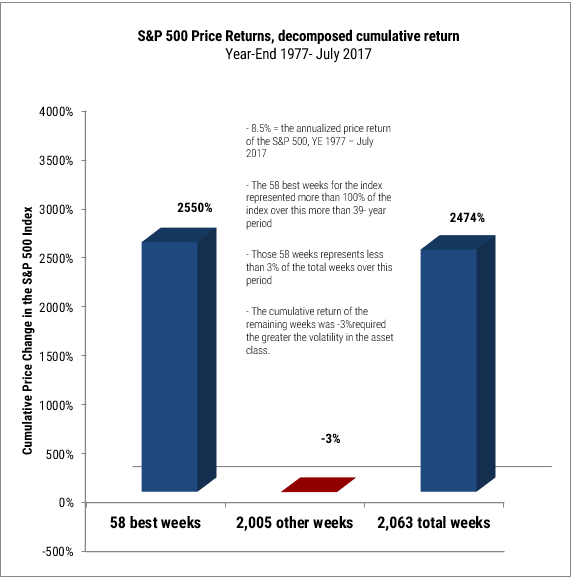
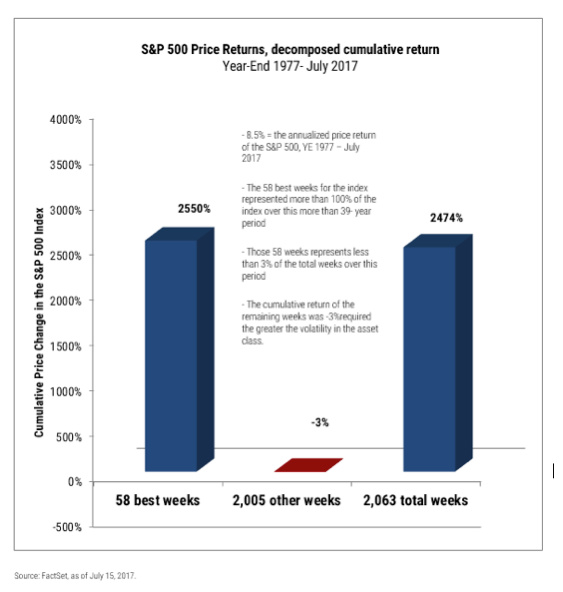
Consider the graph below, which illustrates the cumulative price return of the S&P 500 Index from year end 1977 to mid-July 2017 (39.7 years). The annualized price only return over this period was 8.5% per year, which including dividends would generally be regarded as a robust, even attractive long-term investment return. However, the expression of 8.5% annually grossly overestimates the smoothness of this return. The graph breaks down the 58 best weeks in the S&P 500 and evaluates the cumulative return of those weeks vs. the cumulative return of the remaining 2,005 weeks constituting the full period. The 58 best weeks in the S&P 500 since year end 1977 represents only 2.8% of the number of weeks in this study, but more than 100% of the cumulative return. That’s the work.
Patience is a critical common factor among history’s most successful investors. There will always be reasons not to invest in an asset class, and that list will grow as investors become fearful, which history suggests is a great time to buy. There will also always be periods when good returns are extrapolated into the future, which history suggests investors become too complacent. While there is a vast range of potential scenarios and outcomes in between, our observations lead us to believe the latter situation may be the most accurate understanding of today’s environment. Regardless of what lies immediately in front of equity investors, however, the best long-term returns are those that meet expectations based on a definition risk – it stands to reason, then, that investors with the clearest definition of risk will be likeliest to meet long-term expectations.
Source for performance information: FactSet. Besides attributed data, this material is proprietary and may not be reproduced, transferred or distributed in any form without prior written permission from WST. WST reserves the right at any time and without notice to change, amend, or cease publication of the information. This material has been prepared solely for informative purposes. The information contained herein includes information that has been obtained from third party sources and has not been independently verified. It is made available on an "as is" basis without warranty. This document is intended for clients for informational purposes only and should not be otherwise disseminated to other third parties. Past performance or results should not be taken as an indication or guarantee of future performance or results, and no representation or warranty, express or implied is made regarding future performance or results. This document does not constitute an offer to sell, or a solicitation of an offer to purchase, any security, future or other financial instrument or product. The S&P 500 index is comprised of large capitalized companies across many sectors and is generally regarded as representative of US stock market and is provided in this presentation in that regard only. See the appropriate disclosures regarding models, indices and the related performance. We consider an index to be a portfolio of securities whose composition and proportions are derived from a rules based model. You cannot invest directly in an index and the performance of an index does not represent the performance of any specific investment. Market indices are unmanaged and do not reflect the deduction of fees or expenses. You cannot invest directly in an index such as these and the performance of an index does not represent the performance of any specific investment strategy. We consider an index to be a portfolio of securities whose composition and proportions are derived from a rules based model.
Some of the information enclosed may represent opinions of WST and are subject to change from time to time and do not constitute a recommendation to purchase and sale any security nor to engage in any particular investment strategy.
Besides attributed information, this material is proprietary and may not be reproduced, transferred or distributed in any form without prior written permission from WST. WST reserves the right at any time and without notice to change, amend, or cease publication of the information. This material has been prepared solely for informative purposes. The information contained herein may include information that has been obtained from third party sources and has not been independently verified. It is made available on an “as is” basis without warranty. This document is intended for clients for informational purposes only and should not be otherwise disseminated to other third parties. Past performance or results should not be taken as an indication or guarantee of future performance or results, and no representation or warranty, express or implied is made regarding future performance or results. This document does not constitute an offer to sell, or a solicitation of an offer to purchase, any security, future or other financial instrument or product.