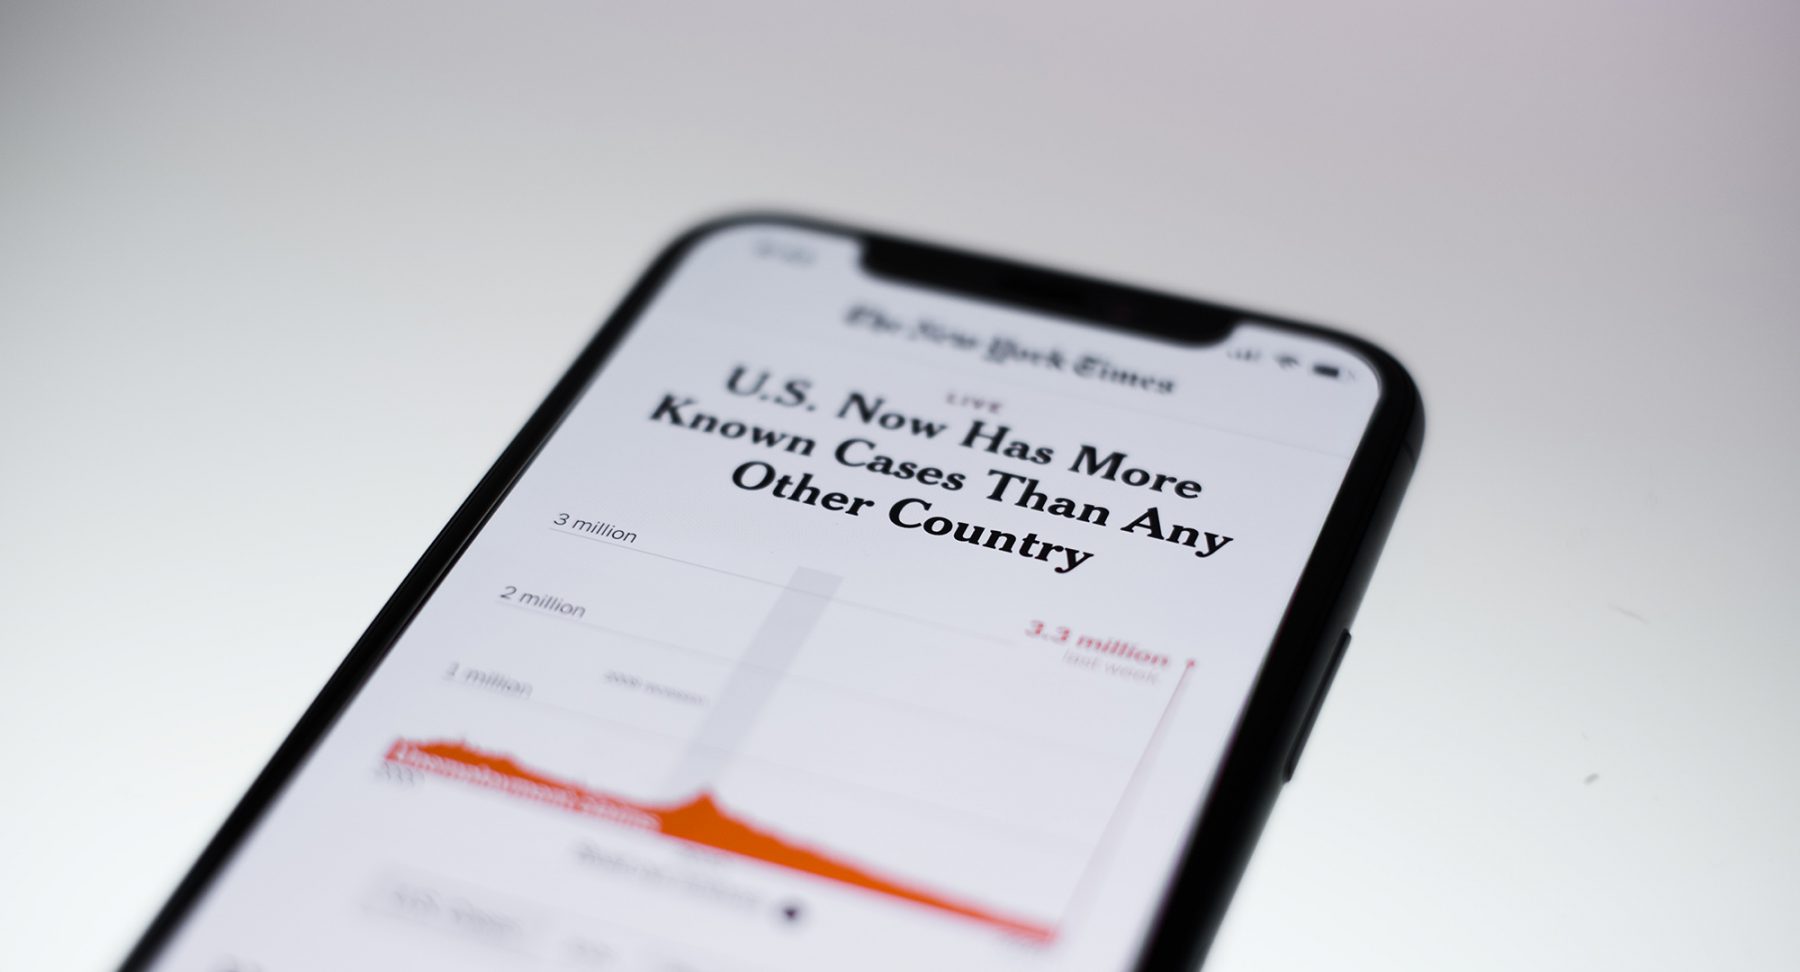
Global Pandemic's Impact on Economy
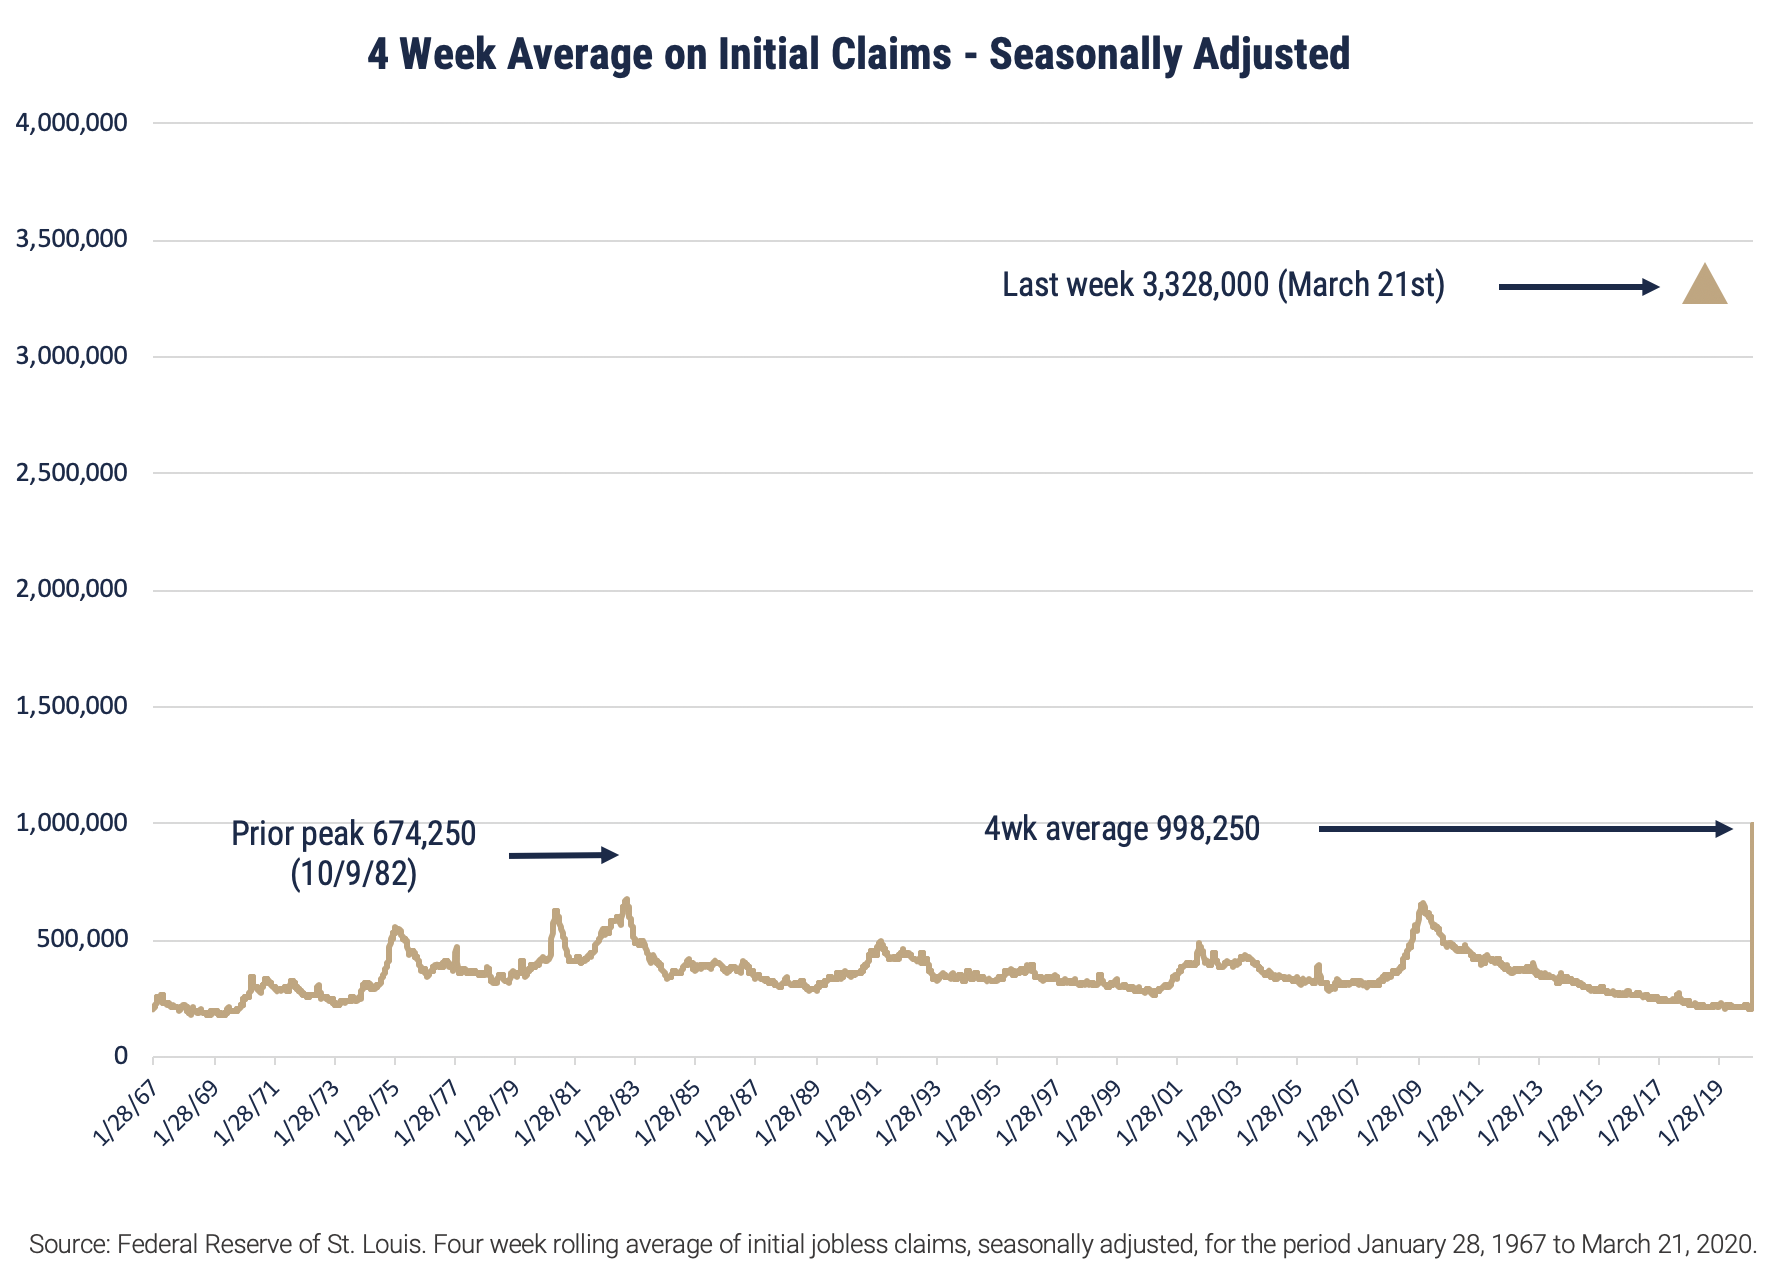
Some of the first real hard data on the economic impact of COVID-19 was received Thursday, March 26th, 2020 – with the release of the report on the state of initial claims for unemployment. This weekly report is unlike other government reports on the economy; with minimal revisions to data, it could be considered one of the most reliable and timely measures of business activity.
The report highlights the outbreak’s harsh impact on jobs; almost 3.3 million people filed an initial claim for unemployment and the graph below illustrates the unprecedented nature of this event. The filings represented 2.8% of the total private payrolls as of February and portends just how quickly the unemployment rate will rise from 50-year lows. The impact is felt most severely with hourly workers – which, according to the Bureau of Labor Statistics, represent almost 59% of the workforce. April 3rd will be the release of monthly payroll data, providing more insight to the extent of the damage in the job market. The recent passage of the CARES Act is aimed directly at offsetting the impact of job losses. This is significant legislation which will likely impact you and/ or your business, therefore it is best to consult with your CPA on how the CARES Act might apply to your situation.
Market Commentary
Newton’s Third Law of physics states that for every action there is an equal and opposite reaction. Much has been written about the record-setting market decline in its pace, but our focus is on the extraordinary volatility in daily market moves and how short-term thinking can impact long term results.
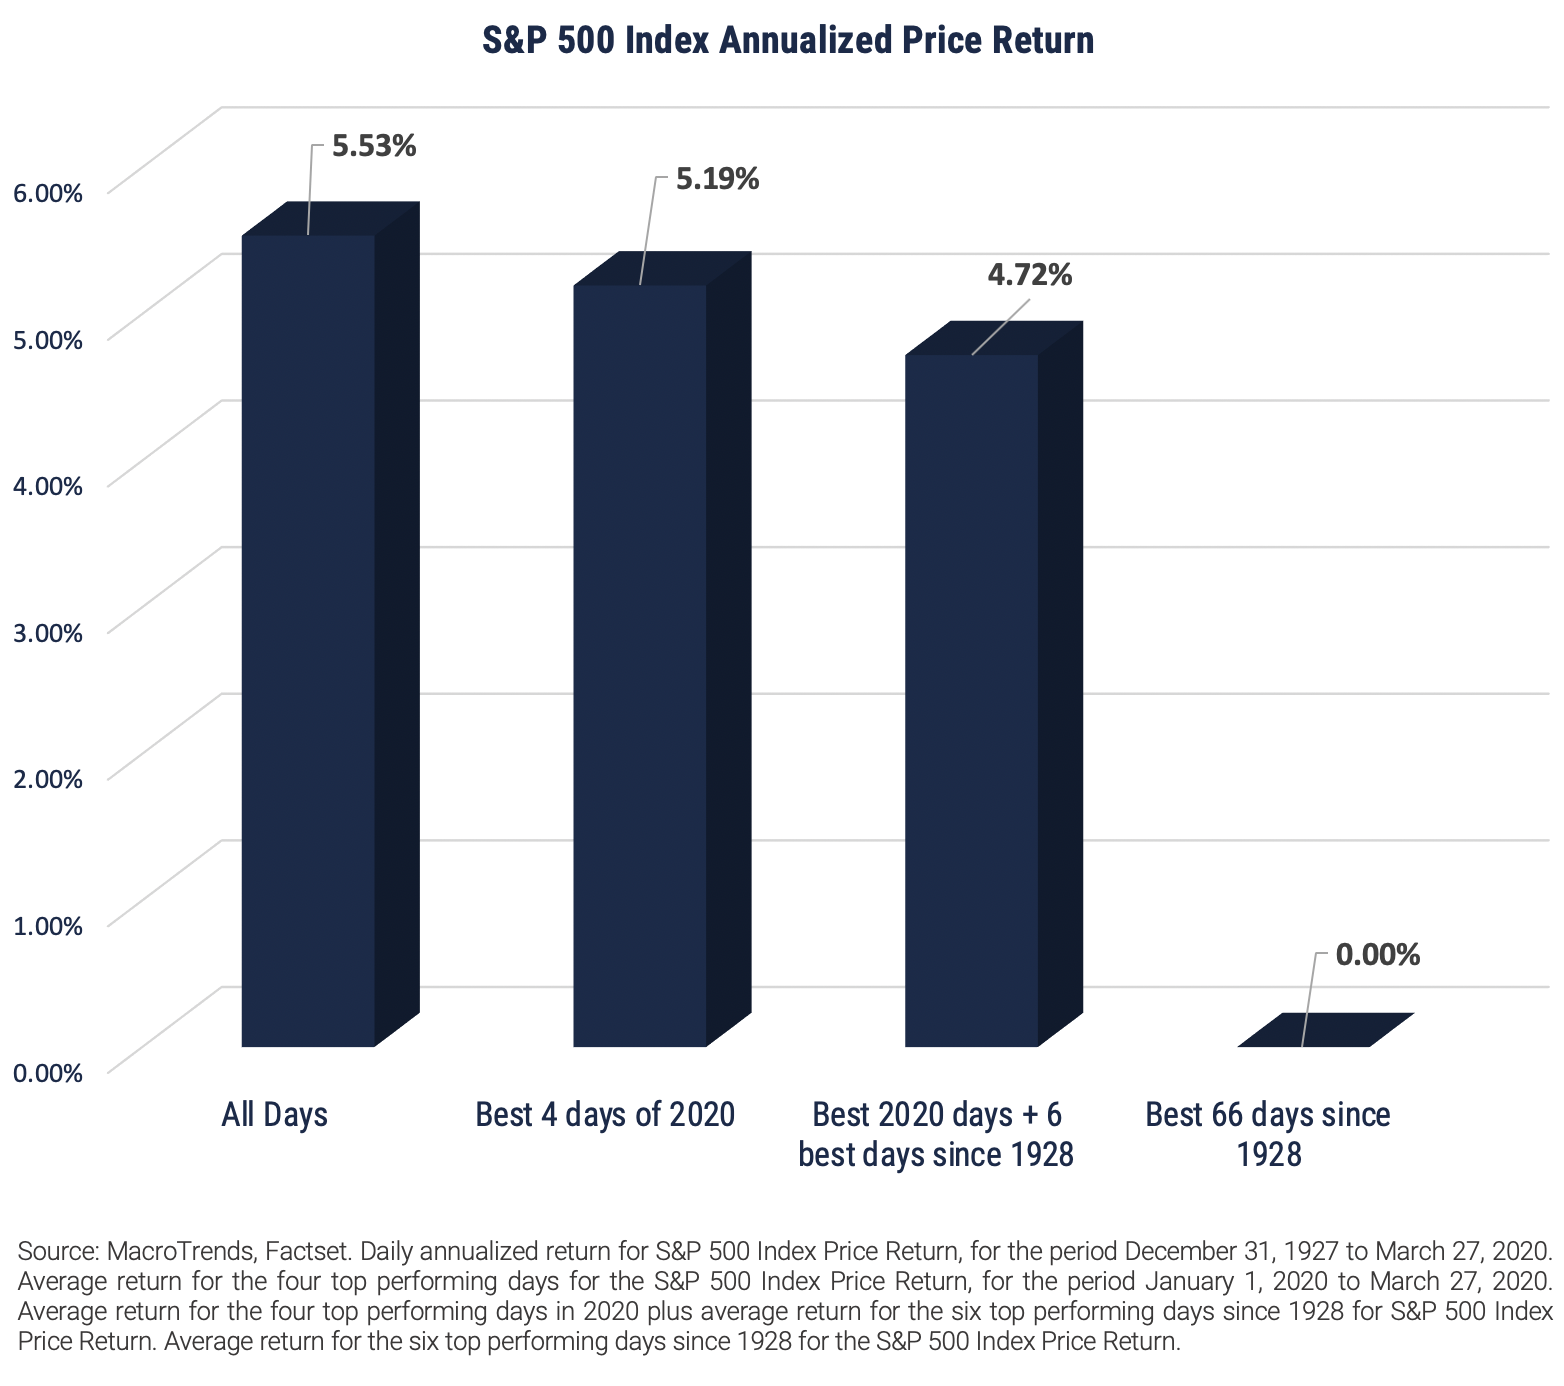
We have examined daily market data in the S&P 500 Stock Index back to 1928 which covers over 24,000 trading days. Of the 75 best and worst days since 1928 (.62% of all days) there are four days in 2020 which fall into the best 75 and three days which fall into the worst 75 days over market history.
When market volatility spikes as it has in 2020, unusually bad and good days will cluster together raising the risk of market timing driven decisions.
What does this all mean? Investors often feel compelled to react to dramatic and quickly falling markets. The concern over a global pandemic and its impact on the economy only adds to the pressure to act in the current market. However, despite the unique nature of the cause behind this market decline, the common thread tying together all periods of heightened volatility is human behavior. Poor decisions during a time of great uncertainty in the short term can have a surprising and adverse long-term impact.
The annualized S&P 500 Index price return during the period 12/31/27 – 3/27/20 is 5.53% per year. The four top performing days during 2020 produced a cumulative return of 34.6% while missing just these four days (out of over 24,000 days) reduces the 92+ year return to 5.19%. Adding the six top performing days since 12/31/27 (10 total days) reduces the long-term annualized return to just 4.72% while missing the top performing 66 days (.27%) reduces the return to 0% per year. The graph addresses the cost of missing the best days in a period of volatility.
There are few periods in history where one event can be identified so clearly as the root cause of a major market decline. Ironically, clarity in cause and effect can often prompt costly decisions. COVID-19 is in a 24/7 news cycle as we believe it well should be until we find a vaccine. Because of its impact and continual coverage, any incremental information will often be immediately reflected in market prices. Reacting to new information, even when it is only hours old, can cause a misstep, potentially impacting longer term results in this market environment.
Visit our blog for upcoming market and COVID-19 updates.
Important Disclosures
Wilbanks, Smith & Thomas Asset Management, LLC (WST) is an investment adviser registered under the Investment Advisers Act of 1940. Registration as an investment adviser does not imply any level of skill or training.
Prior to making any investment decision, you should assess, or seek advice from a professional regarding whether any particular transaction is relevant or appropriate to your individual circumstances. This material is not intended to replace the advice of a qualified tax advisor, attorney, or accountant. Consultation with the appropriate professional should be done before any financial commitments regarding the issues related to the situation are made.
An index is a portfolio of specific securities, the performance of which is often used as a benchmark in judging the relative performance to certain asset classes. Index performance used throughout is intended to illustrate historical market trends and performance. Indexes are managed and do not incur investment management fees. An investor is unable to invest in an index. Their performance does not reflect the expenses associated with the management of an actual portfolio. No strategy assures success or protects against loss. There is no guarantee that a diversified portfolio will enhance overall returns or outperform a non-diversified portfolio. Diversification does not protect against market risk. All investing involves risk including loss of principal. Investing in stock includes numerous specific risks including: the fluctuation of dividend, loss of principal, and potential liquidity of the investment in a falling market.
S&P 500: Standard & Poor’s (S&P) 500 Index. The S&P 500 Index is an unmanaged, capitalization-weighted index designed to measure the performance of the broad U.S. economy through changes in the aggregate market value of 500 stocks representing all major industries.
Besides attributed information, this material is proprietary and may not be reproduced, transferred or distributed in any form without prior written permission from WST. WST reserves the right at any time and without notice to change, amend, or cease publication of the information. This material has been prepared solely for informative purposes. The information contained herein may include information that has been obtained from third party sources and has not been independently verified. It is made available on an “as is” basis without warranty. This document is intended for clients for informational purposes only and should not be otherwise disseminated to other third parties. Past performance or results should not be taken as an indication or guarantee of future performance or results, and no representation or warranty, express or implied is made regarding future performance or results. This document does not constitute an offer to sell, or a solicitation of an offer to purchase, any security, future or other financial instrument or product.