
Q2 2021 | Quarterly Economic & Markets Overview
“As long as the music is playing you’ve got to get up and dance.” - Chuck Prince, Citibank CEO, 2007
“The most important thing to remember is that inflation is not an act of God, that inflation is not a catastrophe of the elements or a disease that comes like the plague. Inflation is a policy.” - Ludwig Van Meses
The global recovery accelerated in the second quarter as COVID-19 retreated and economies around the world reopened, albeit at widely varied rates.
Over a quarter of the world’s population has received at least one dose of vaccine, and almost half of the U.S. population has had two doses. As COVID is being contained, pent-up consumer and business demand is being unleashed, and global output and consumption of goods and services are growing at their fastest pace in decades. Economists are increasingly hopeful that the permanent "scarring" from the pandemic will be minimal, and while the pace of the recovery varies depending upon the relative success of regional vaccine programs, there is hope that COVID will be tamed in the next several quarters as testing, vaccines, and treatment options continue to progress and improve.
The markets recognized the improving economic picture by marching higher over the past three months, particularly in the U.S., with investors pricing in the better-than-expected economic and earnings data and setting aside concerns about the durability of the cycle. At some point we will need to turn our attention to the inevitable deceleration from today’s robust expansion, but for now investors are willing to live by the adage “as long as the music is playing you’ve got to get up and dance.” We are a bit haunted by our recollection of that quote being used by then-Citigroup CEO Chuck Prince in 2007 to justify the bank’s aggressive tactics just prior to the onset of the financial crisis, but, for now at least, the data is undeniably supportive of corporate earnings and equities. While some equity markets including the U.S. appear expensive, others are not. The uneven rollout of vaccines around the world has resulted in an asynchronous recovery, so growth in other parts of the world will likely accelerate later this year, at least partially offsetting any potential slowdown at home.
Rising vaccine rates and declining case counts brightened the employment picture since our last note in April. U.S. employers added 850,000 jobs in June and wages rose strongly, reflecting healthy demand for workers. Hurdles to hiring should continue to fall as restrictions on businesses and in-person gatherings ease and unemployment benefits expire in more states. Even so the labor market in the U.S. is not out of the woods. Despite the recent uptick there are still 6.8 million fewer Americans working than there were in February 2020, and the unemployment rate remains higher than the pre-pandemic level of 3.5%. At this stage of the recovery the job market faces an interesting conundrum: while large numbers of Americans are still out of work labor shortages are hindering many companies and industries. The hospitality and leisure sectors remain particularly challenged as the accelerating reopening has driven a huge surge in demand at a time when the Federal government continues to provide jobless workers with a $300 per week benefit supplement on top of state unemployment payments. The health of the labor market is a key variable in the debate around Fed policy, so it will be an increasingly important indicator to watch in coming months.
Given the strong recovery and the outlook for continued growth into 2022, investors have identified inflation as the most serious risk facing the markets, and an unanticipated hawkish shift in Fed policy tops our list of potential challenges for the second half of the year. Last fall we detailed the important change in the Fed’s inflation framework, which eliminated the previous hard 2% inflation target in favor of “average inflation targeting,” a strategy that allows inflation to run moderately above 2% "for some time" if prior years’ price increases have been running persistently below the long term 2% target. While the specific wording of the new policy is intentionally vague and gives the FOMC lots of leeway in setting policy, the fact that the PCE (Personal Consumption Expenditures) inflation figure, the Fed’s favored measure of inflation, has grown at only 1.5% per year on average for 10 years implies the Fed may allow annual inflation of close to 2.5% over the next decade before stepping in. That line of thinking is inconsistent with the recent statements from several Fed officials who indicated after their last meeting a desire to begin raising rates as soon as 2022. The internal debate at the Fed is increasingly important as the economy emerges from the COVID crisis and markets assess the longer-term implications of the new policy.
For now, we are cautiously optimistic that the spike in headline inflation expected in the second half of 2021 will be, to use the Fed's word, transitory. Prices were depressed last year by the pullback in demand as the pandemic hit, so year-over-year comparisons exaggerated price increases this spring and into early summer. This base effect will roll off in coming months, mitigating the headline inflation numbers. The price impact of pent-up demand should be a one-time factor and will also likely be short-lived. Commodity and freight prices surged on temporary supply constraints but have already begun to decline as supply chains come back online. Income replacement programs including the extraordinary unemployment payments will begin to fade this summer and fall, normalizing demand and reducing the risk of an overheated economy. Finally, the slack in the employment market and still-depressed capacity utilization suggests more room for expansion without inducing supply-side, cost push inflation. So, while families and businesses are flush with cash and are fueling a surge in demand across the economy, we think these forces will moderate over the next several quarters.
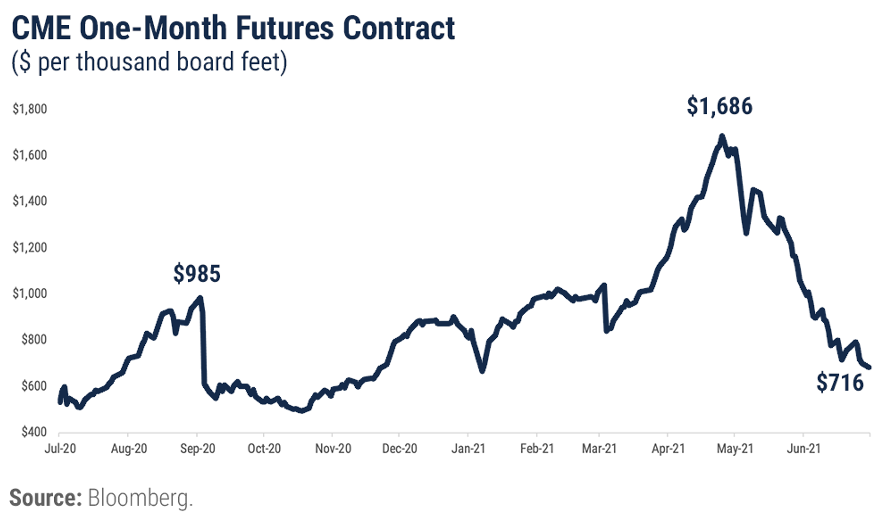
The recent action in lumber prices offers a case study for the inflation debate, and the following graph demonstrates the dynamic at work in the commodities markets. Prices surged during the pandemic-driven home-improvement boom and have pulled back sharply as homeowners redirect spending from decks and flooring to clothing, dining out and other "normal" consumption categories. The recent decline in lumber prices offers some comfort that the burst of inflation driven by supply/demand imbalances will pass, but it's important to note that lumber prices remain higher than historical averages.
Even before the pandemic inflation hawks had expressed concerns about several secular shifts adding to long-term inflationary pressures. We wrote last year about the impact of "de-globalization" as the U.S./China trade war heated up. Globalization has had a disinflationary effect on the economy for decades as cross-border trade and investment steered capital to low-cost producers and spurred competition among producers around the world, allowing businesses and consumers to source products inexpensively. Tariffs, nationalism, and other impediments to free trade create friction in the global supply network, raising costs on all types of materials and manufactured goods. Demographic shifts also may push inflation higher in coming years. As populations in large, developed economies like the U.S. and China age the ratio of consumers to savers rises, increasing aggregate demand and pushing prices higher on the margin. Finally, the deflationary impact of technology and e-commerce appears to have peaked. For decades businesses and consumers have benefited from the increasing market efficiency and competition brought by price transparency and broader access to different providers of goods and services. At this point most of that efficiency has been realized. So, while we don’t expect the current spike in inflation to continue through the end of the year, we do recognize the likelihood of longer-term inflation in the 2.0-2.5% range.
EQUITY MARKET OVERVIEW
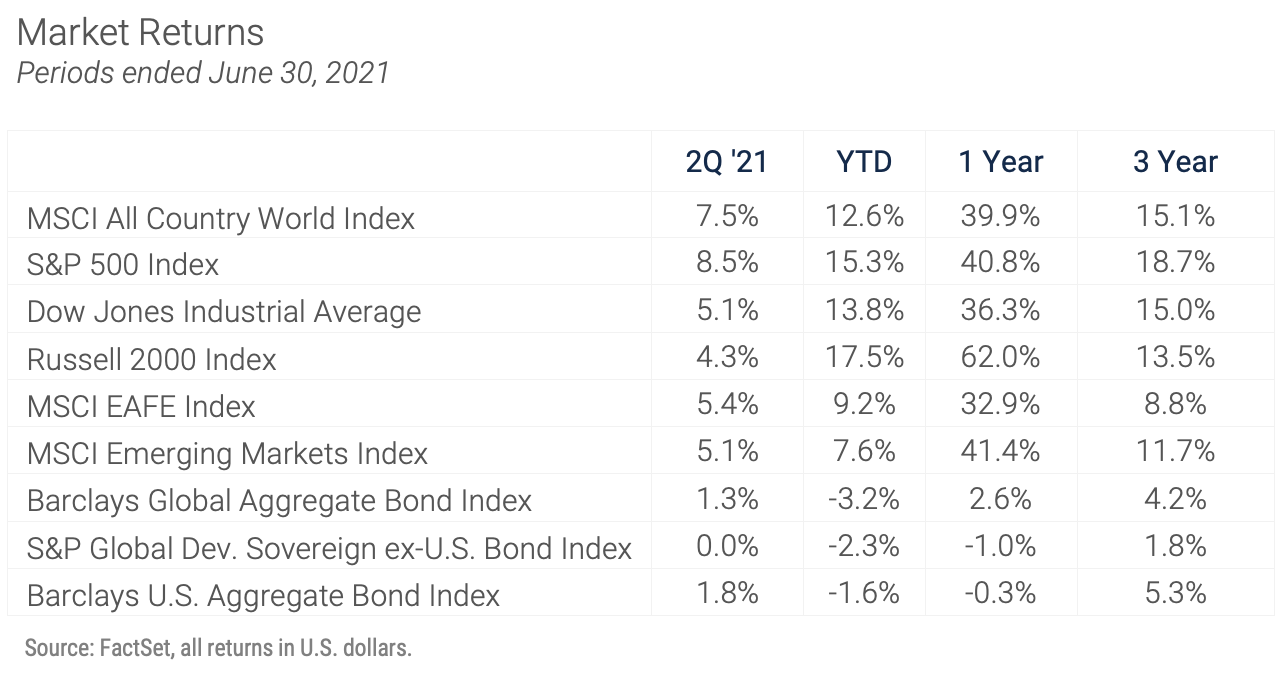
Stock prices continued their upward trajectory in the second quarter with positive performance across the board. The gains brought year-to-date returns into double digits with the S&P 500 up 15.3% for the first half of 2021 and an amazing 92% since the COVID-driven low on March 23 of last year. The Russell 2000 Index of small-cap stocks performed even better in the first half and closed June up 17.5% year-to-date. The strong returns were driven by rising earnings estimates as optimism about the economic recovery grew. With much of the good news about the economic recovery already baked into prices valuations are high, if not stretched, by virtually all metrics, so gains will likely be harder to come by in the second half.
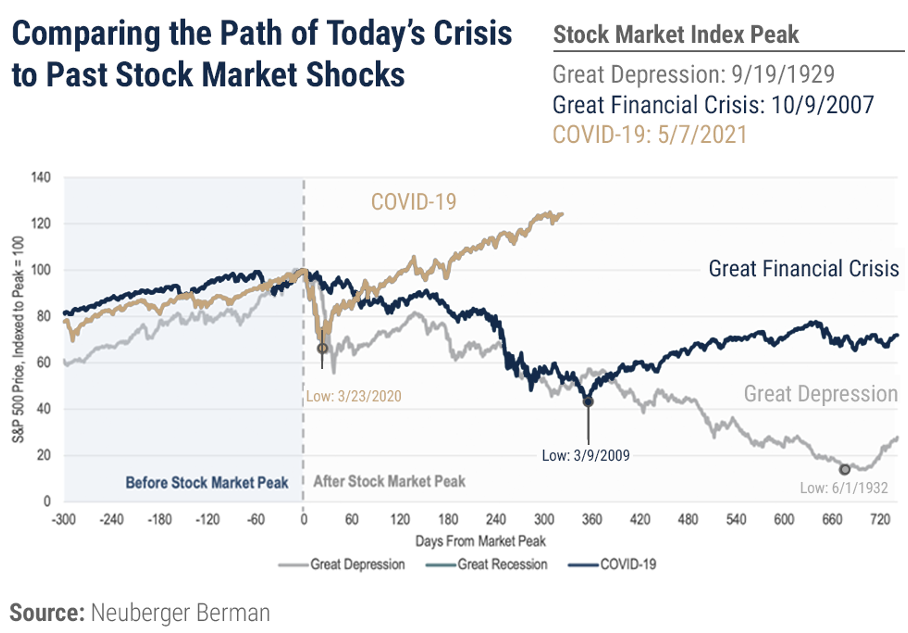
The graph above, courtesy of Neuberger Berman, compares the remarkable post-COVID rally in U.S. equities with the long bear markets brought on by the Great Depression and the Great Financial Crisis. There can be no doubt that the massive fiscal and monetary responses undertaken by the U.S. government in response to the pandemic averted a much longer and deeper recession and market decline. The key questions facing investors now involve the pace at which that stimulus will be withdrawn, and how the markets will respond. In the best-case scenario, the current spike in inflation will prove to be transitory and the Fed will be able to keep policy loose, following the very gradual tightening path implied by its forward guidance. In that benign environment equity prices can continue to grow along with corporate earnings. If on the other hand inflation continues to run higher than expected, the Fed will be faced with a no-win decision. If they stay on the sideline too long and the economy overheats the bond market will take matters into its own hands, and we'll see a steepening yield curve that destabilizes both the fixed income and equity markets. If the Fed sees the economy overheating and tightens policy sooner than expected they run the risk of killing the recovery. Equity and other risk assets will likely sell off as the yield curve flattens. So, the "just right" inflation scenario is the only path we see to continued strong equity market performance.
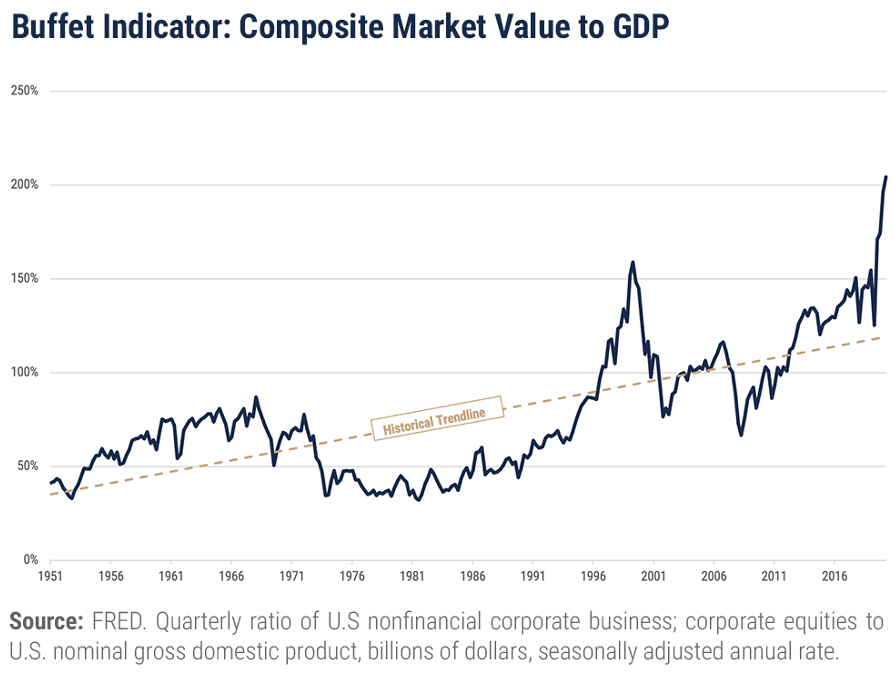
The U.S. market also faces a challenging valuation. Warren Buffet’s favorite indicator, the ratio of the total U.S. stock market to U.S GDP, counsels caution. The indicator has never been higher and today stands at almost double its long-term average level, notably higher than its prior peak in 2000.
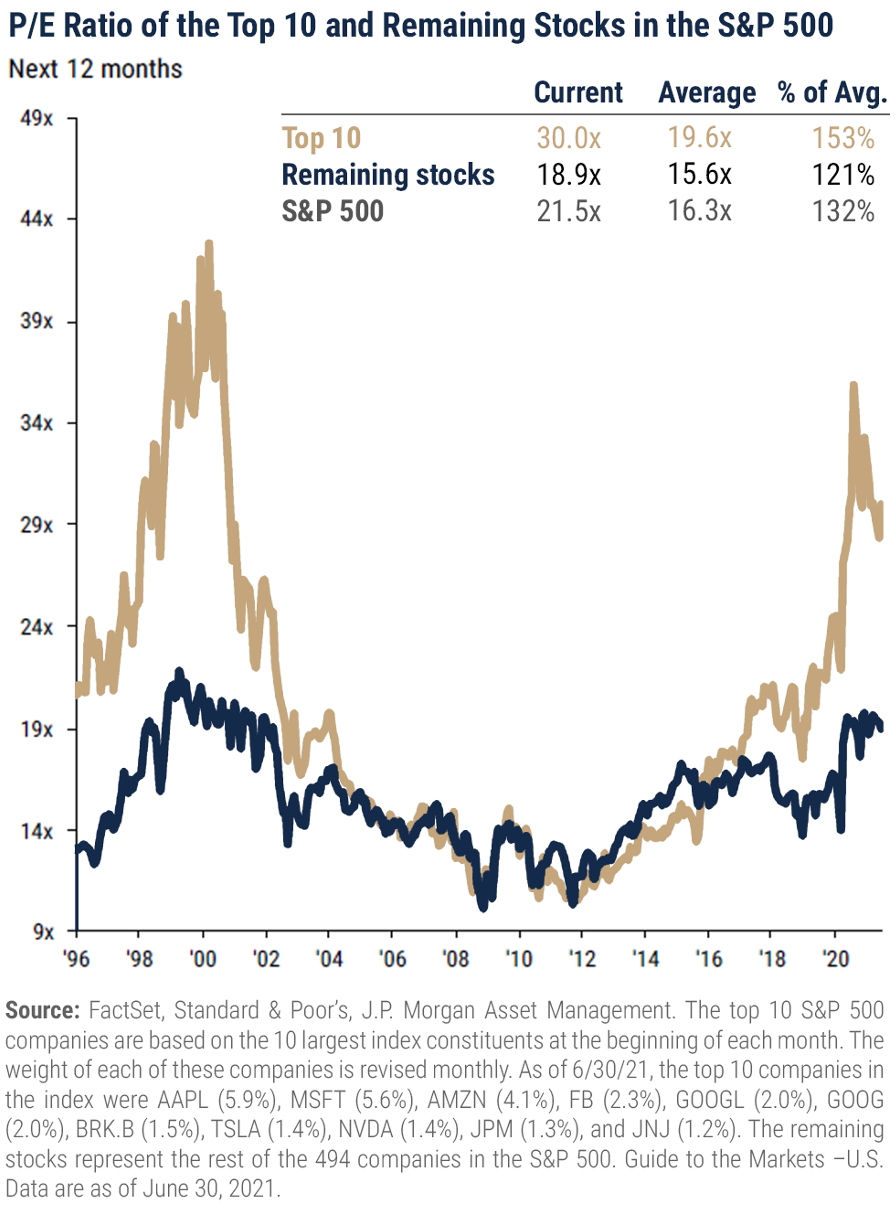
Digging a little deeper we take some comfort in the fact that while the ten biggest stocks in the S&P 500 are trading at a 30 P/E ratio the remaining 490 are much more reasonably priced. Mid and small-cap stocks outside of the S&P 500 also offer better relative value.
With U.S. equity valuations uncomfortably high we continue to look at stocks in other parts of the world for better performance in coming years. As of June 30, foreign stocks as represented by the MSCI All country World ex-U.S. index were trading at a 27% discount to the S&P 500, an all-time high gap between domestic and foreign stocks.

Admittedly it takes patience to remain committed to global equity diversification after a decade of outperformance by U.S equities, and particularly U.S. large-cap stocks. Through the end of June, the S&P 500 has posted a 17.6% annualized five-year return, and the Russell 1000 index of U.S. large-cap growth stocks has returned 23.6% annually over the same time frame. The 10.8% annualized return on the MSCI EAFE index and the 13.4% five- year return for the MSCI Emerging Markets Index, while positive in absolute terms, pale in comparison. As outlined above, the economic recoveries in countries around the world have largely lagged that in the U.S. because no other part of the world has seen the scale and coordination of policy support provided by the U.S. government. Equally important, most of the world remains behind the U.S. in responding to COVID. Despite policy hurdles economic growth is still expected to be stronger around the world than it is domestically. The euro area foresees full year growth of around 5%, and GDP should reach its pre-pandemic level in the first half of 2022. Despite the slowdown in China, growth there is still forecast to be above 8% this year. Emerging markets as a whole should see full year growth above 6% although with wide dispersion of performance.
BOND MARKET OVERVIEW
Over the course of the second quarter the bond market rebounded from the first quarter’s drubbing despite the strengthening economy and uptick in inflation. Fixed income investors continued to snap up debt of all maturity and credit structures even as yields retreated. The Barclay’s U.S. Aggregate Bond Index ended the quarter with total return of 1.8%, still down 1.6% year to date. The real action was in the long end of the curve where the iShares 20+ Year Treasury Bond ETF was up 7% for the quarter after falling 15% in the first quarter. Credit spreads remained largely unchanged.
The central force behind the second-quarter’s bond rally was the continued support from central bankers, but in our view the rollover in rates was also driven by markets marking down their expectations for growth and inflation. As always, the action in the bond market is being driven by the interplay among those factors: economic growth, inflation, and central-bank policy. As we discussed above the surging demand for goods and services as the economy reopens, in the context of downsized and inefficient supply chains, has driven a lift in inflation, at least in the short term, and raised questions about the longer-term outlook. As central banks slow and eventually stop their purchases of government bonds and allow the size of their balance sheets to shrink, markets will experience some upward pressure on yields. Still, we expect the Fed to remain vigilant despite its shifting framework and while we do expect yields to rise modestly off today's near-record low levels, we don't foresee a major spike in interest rates on the horizon.
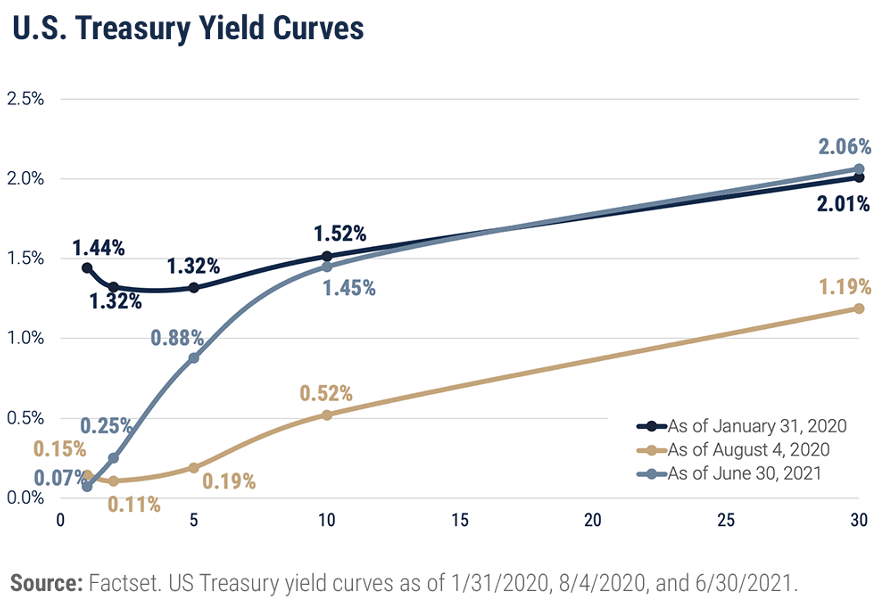
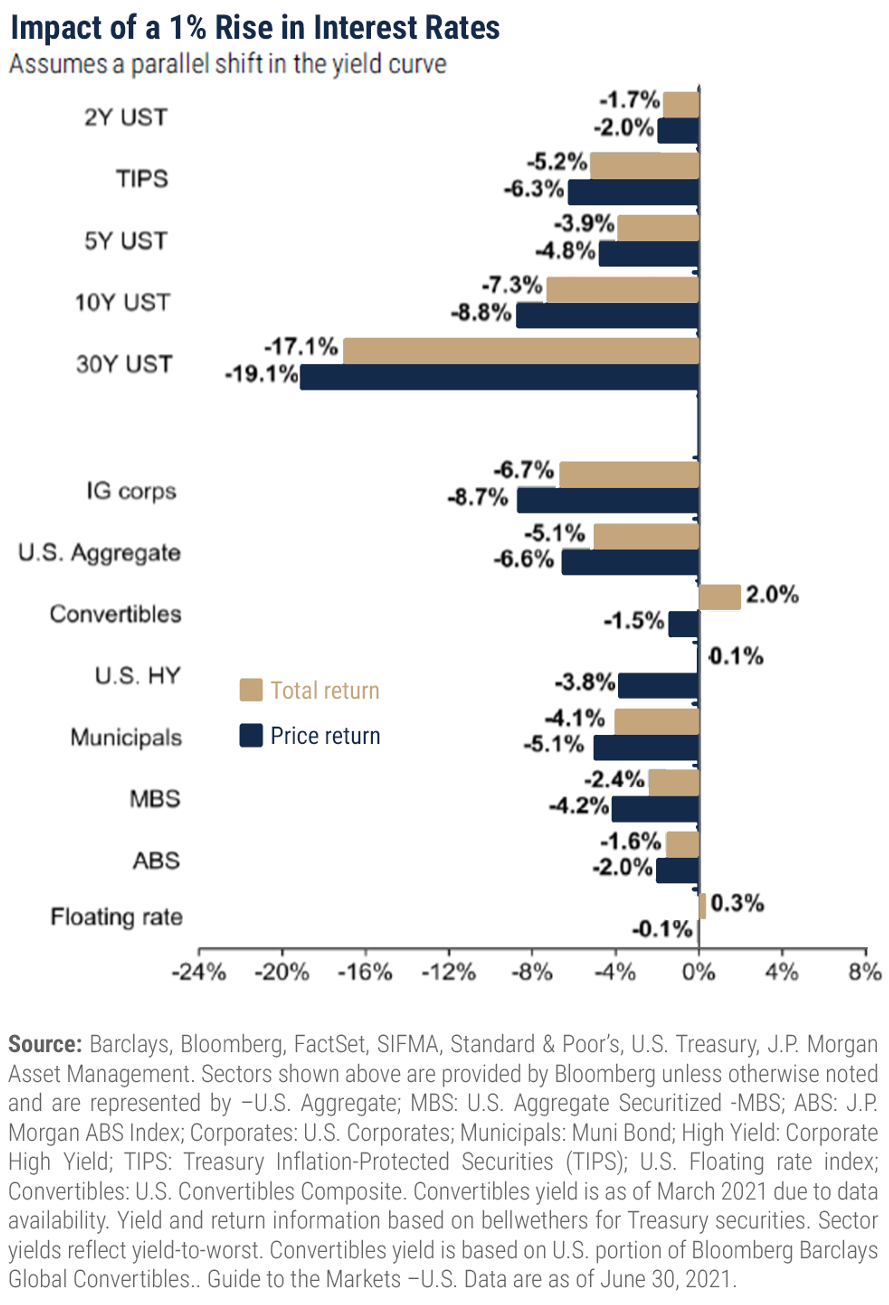
Even so, we remain with a tactically short duration in fixed income portfolios. With interest rates at current levels and the yield curve flat, the risk/reward trade-off for extending the maturity structure of bond portfolios is very poor. As of June 30, the yield to maturity for a 10-year Treasury bond was under 1.5%, and as the following graph reveals a 1% increase in that rate would result in a price decline of 8.8%. Looking at it a different way, a 1% increase in rates could wipe out six years of income for a holder of that bond. The math is even more challenging for longer-term bonds with the 30-year Treasury yielding 2% at the end of the quarter and susceptible to a 20% price decline in the event of a 1% yield increase. So, despite our relatively benign outlook for rates we remain defensively invested in portfolios.
POSITIONING & OUTLOOK
Current portfolio positioning reflects the opportunities and risks presented by the strong but unsynchronized global economic recovery. Inflation is in the spotlight, and the big question is whether the recent spike is temporary - as pent-up demand works through the economy and supply bottlenecks resolve - or, if price pressures will prove more persistent.
Equities remain the engine of long-term growth, and within the stock segment of portfolios we are maintaining our core exposure to the broad U.S. market. Uneven growth around the world has driven valuation gaps among global markets to historical highs, and we continue to rebalance portfolios with an eye toward maintaining target allocations to less expensive geographies. The same is true within segments of the U.S. market. Small-cap stocks, and particularly small-cap value stocks, have led the performance race so far this year but we believe remain cheap relative to the big growth names.
Bond portfolio positioning reflects the dearth of yield available in general and the unbalanced risk return picture created by the low, flat yield curve. Short duration bonds and exposure to credit risk where it is rewarded are the order of the day.
All in all, we continue to "dance while the music is playing," while listening closely for a change in tempo!
Important Disclosures
Unless otherwise indicated, performance information for indices, funds and securities as well as various economic data points are sourced from FactSet as of December 31, 2020.
Wilbanks, Smith & Thomas Asset Management (WST) is an investment adviser registered under the Investment Advisers Act of 1940. Registration as an investment adviser does not imply any level of skill or training. The information presented in the material is general in nature and is not designed to address your investment objectives, financial situation or particular needs. Prior to making any investment decision, you should assess, or seek advice from a professional regarding whether any particular transaction is relevant or appropriate to your individual circumstances. This material is not intended to replace the advice of a qualified tax advisor, attorney, or accountant. Consultation with the appropriate professional should be done before any financial commitments regarding the issues related to the situation are made.
This document is intended for informational purposes only and should not be otherwise disseminated to other third parties. Past performance or results should not be taken as an indication or guarantee of future performance or results, and no representation or warranty, express or implied is made regarding future performance or results. This document does not constitute an offer to sell, or a solicitation of an offer to purchase, any security, future or other financial instrument or product. This material is proprietary and being provided on a confidential basis, and may not be reproduced, transferred or distributed in any form without prior written permission from WST. WST reserves the right at any time and without notice to change, amend, or cease publication of the information. The information contained herein includes information that has been obtained from third party sources and has not been independently verified. It is made available on an "as is" basis without warranty and does not represent the performance of any specific investment strategy.
Some of the information enclosed may represent opinions of WST and are subject to change from time to time and do not constitute a recommendation to purchase and sale any security nor to engage in any particular investment strategy. The information contained herein has been obtained from sources believed to be reliable but cannot be guaranteed for accuracy.
Besides attributed information, this material is proprietary and may not be reproduced, transferred or distributed in any form without prior written permission from WST. WST reserves the right at any time and without notice to change, amend, or cease publication of the information. This material has been prepared solely for informative purposes. The information contained herein may include information that has been obtained from third party sources and has not been independently verified. It is made available on an “as is” basis without warranty. This document is intended for clients for informational purposes only and should not be otherwise disseminated to other third parties. Past performance or results should not be taken as an indication or guarantee of future performance or results, and no representation or warranty, express or implied is made regarding future performance or results. This document does not constitute an offer to sell, or a solicitation of an offer to purchase, any security, future or other financial instrument or product.