
October 2020: Global Equity Markets Review
Finance theory will tell you the value of a stock is the discounted value of future cash flows. That sounds reasonable in a textbook but oftentimes investors shift their focus toward a much shorter time frame – the here and now. This is certainly one of those times as rising concerns over another COVID-19 wave, the realization of slow progress on another round of fiscal stimulus, and the national election all collided in the month of October.
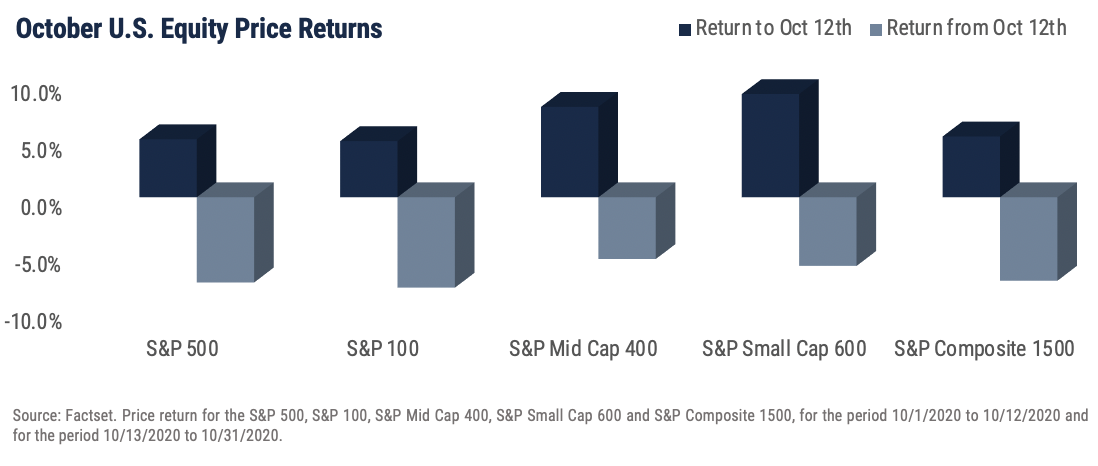
The month started off with a rising optimism over incremental economic data showing a continued rebound from spring lows. Early reports on 3rd quarter earnings confirmed the trend as analysts were surprised by the rebound in business. However, enthusiasm waned as the month progressed and on October 12th the market peaked for the month. The graph below shows the reversal with the decline being enough to produce a negative result for the entire month.
The inability of Congress to agree on another round of stimulus was deeply partisan and the lack of a consensus comes at a critical time. There is not enough momentum in the recovery to be self-sustaining and strong enough to replace the jobs lost this year. Client questions about the impact of a national election increase every four years but 2020 has brought more inquiries than most. History can provide clues as to the impact elections have on market returns, but we caution about relying too heavily on the results. The reality is there are a myriad of crosscurrents affecting the market every year, including election years. Those who claim prescience in parsing out the contribution to returns from all the factors are full of hubris at best or are guilty of sophistry at worst.
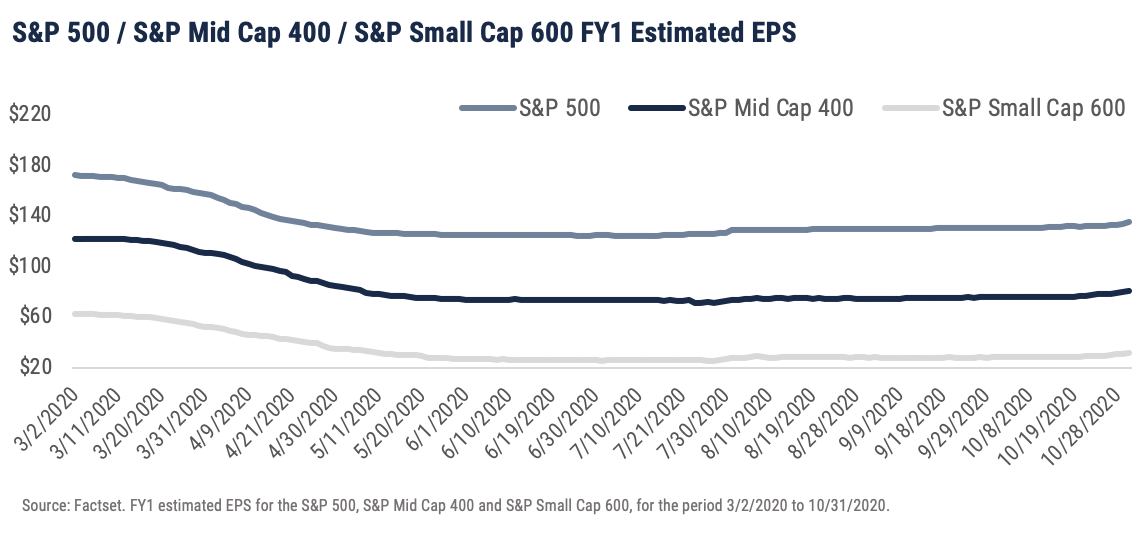
While political headwinds were building during the month, optimism on the earnings rebound gathered steam. Also, noticeable has been the broadening out from companies that have benefitted from the pandemic to those negatively impacted but not as bad as feared. A sustained rally in the market needs to move beyond the concentrated handful of mega cap stocks written about in past monthly reviews to include those which make up most listings on the major exchanges. The graph below illustrates the rebound in current fiscal year earnings estimates in the S&P 500, S&P Mid Cap 400 and S&P Small Cap 600. The reports for the 3rd quarter are clearly pushing estimates higher for all three indexes. This good news is expected to carry into the 4th quarter as well unless COVID-19 news meaningfully slows the 3rd quarter progress. One word of caution is the expected growth rate in 2021 earnings versus 2020 is historically high along with valuation on trailing data. So, disappointment in how fast profits are growing should not be ignored.
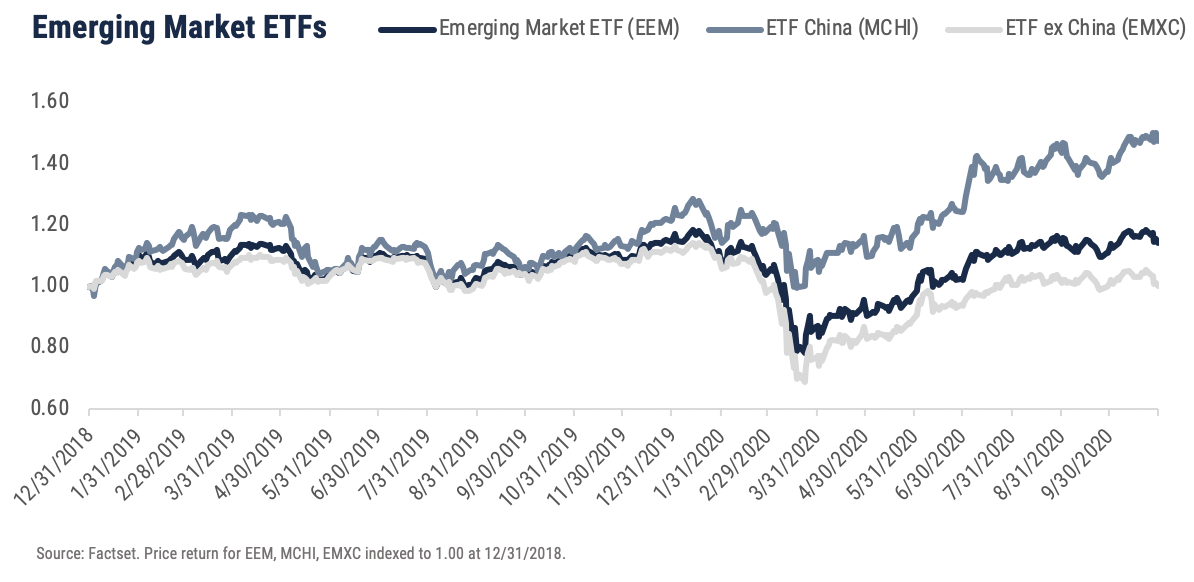
Developed market equities followed the U.S. lead downward in the 2nd half of the month with the EAFE index trailing the S&P 500 returns. Fear of another wave of COVID-19 has gripped much of Europe with lockdowns being discussed in several countries. The European Central Bank (ECB) has reacted much the way our Federal Reserve has with unprecedented monetary stimulus in both speed and scope. Fiscal stimulus packages remain country by country which hampers a coordinated effort. Emerging markets fared better although below the surface it was less than advertised. China, which is the 2nd largest economy in the world after the U.S., is still designated a developing economy. However, with respect to the designers of global equity markets, it remains in emerging market benchmarks. The largest emerging market ETFs currently have between 43-45% allocation weights in China which is a dominant factor in overall performance. October was a strong month for China equity shares easily beating the benchmark index for emerging markets. This continues a strong year for this market with four of the ten months in 2020 ranking in the top 20 months of China outperformance since early 2011. China’s performance both in 2019 and so far in 2020 has been outstanding versus emerging market indexes excluding China which is illustrated in the graph below. The composition in the emerging market benchmarks is an important consideration going forward.
Important Disclosures
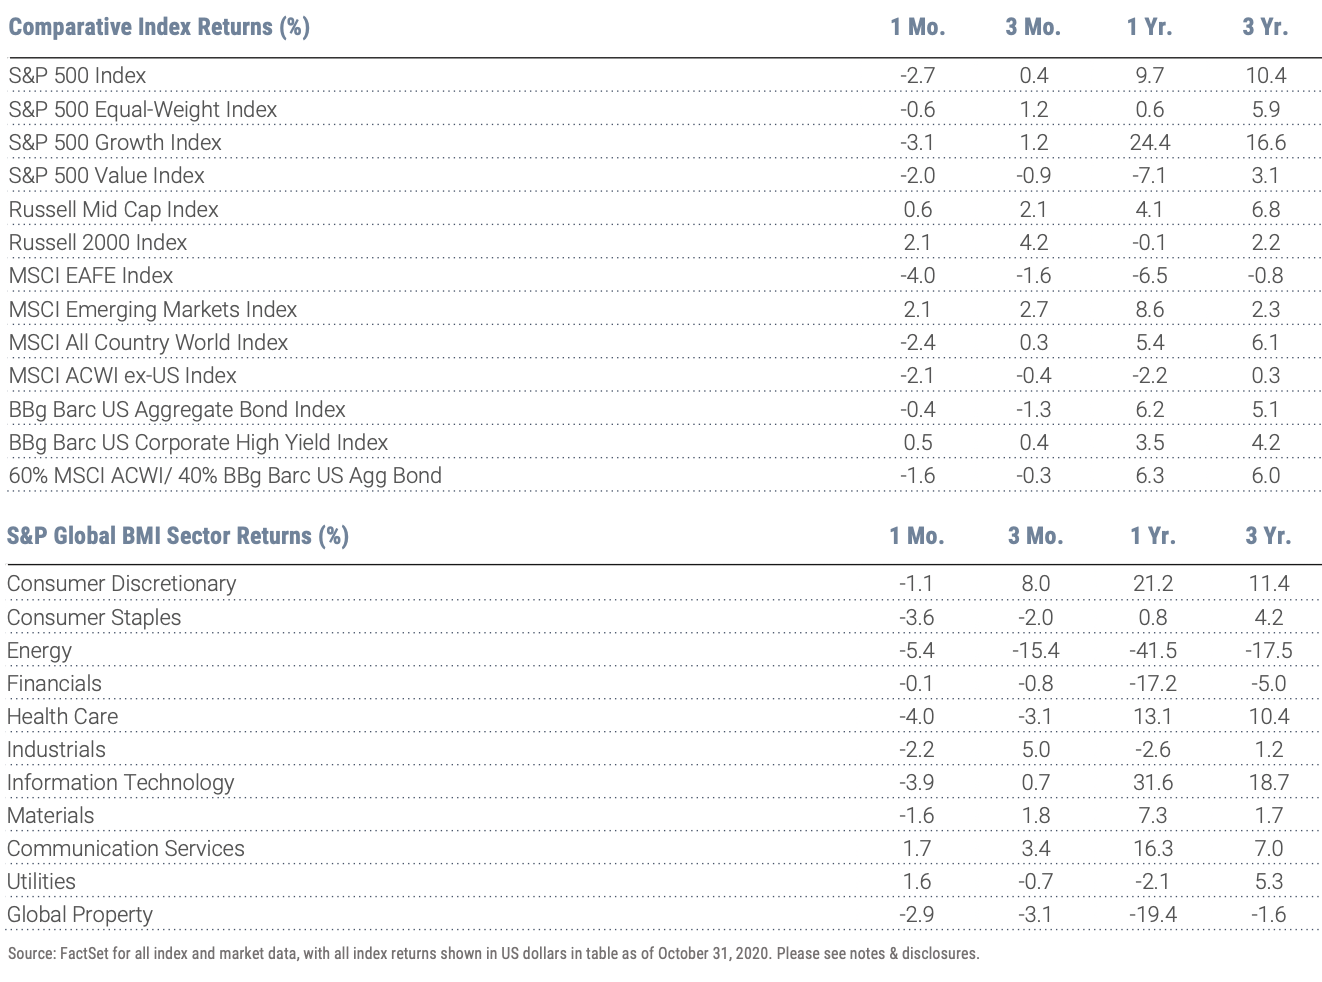
Index Returns – all shown in US dollars
All returns shown trailing 10/31/2020 for the period indicated. “YTD” refers to the total return as of prior-year end, while the other returns are annualized. 3-month and annualized returns are shown for:
- The S&P 500 index is comprised of large capitalized companies across many sectors and is generally regarded as representative of US stock market and is provided in this presentation in that regard only.
- The S&P 500® Equal Weight Index (EWI) is the equal-weight version of the widely-used S&P 500. The index includes the same constituents as the capitalization weighted S&P 500, but each company in the S&P 500 EWI is allocated a fixed weight - or 0.2% of the index total at each quarterly rebalance. The S&P 500 equal-weight index (S&P 500 EWI) series imposes equal weights on the index constituents included in the S&P 500 that are classified in the respective GICS® sector.
- The S&P 500 Growth Index is comprised of equities from the S&P 500 that exhibit strong growth characteristics and is weighted by market-capitalization.
- The S&P 500 Value Index is a market-capitalization weighted index comprising of equities from the S&P 500 that exhibit strong value characteristics such as book value to price ratio, cash flow to price ratio, sales to price ratio, and dividend yield.
- The Russell 3000 Index tracks the performance of 3000 U.S. corporations, determined by market-capitalization, and represents 98% of the investable equity market in the United States.
- The Russell Mid Cap Index measures the mid-cap segment performance of the U.S. equity market and is comprised of approximately 800 of the smallest securities based on current index membership and their market capitalization.
- The Russell 2000 Index is a market-capitalization weighted index that measures the performance of 2000 small-cap and mid-cap securities. The index was formulated to give investors an unbiased collection of the smallest tradable equities still meeting exchange listing requirements.
- The MSCI All Country World Index provides a measure of performance for the equity market throughout the world and is a free float-adjusted market capitalization weighted index.
- The MSCI EAFE Index is a market-capitalization weighted index and tracks the performance of small to large-cap equities in developed markets of Europe, Australasia, and the Far East.
- The MSCI Emerging Markets Index is a float-adjusted market-capitalization index that measures equity market performance in global emerging markets and cannot be purchased directly by investors.
- The S&P Global BMI sector indices are into sectors as defined by the widely used Global Industry Classification Standards (GICS) classifications. Each sector index comprises those companies included in the S&P Global BMI that are classified as members of respective GICS® sector. The S&P Global BMI Indices were introduced to provide a comprehensive benchmarking system for global equity investors. The S&P Global BMI is comprised of the S&P Emerging BMI and the S&P Developed BMI. It covers approximately 10,000 companies in 46 countries. To be considered for inclusion in the index, all listed stocks within the constituent country must have a float market capitalization of at least $100 million. For a country to be admitted, it must be politically stable and have legal property rights and procedures, among other criteria.
- The Barclay’s US Aggregate Index, a broad based unmanaged bond index that is generally considered to be representative of the performance of the investment grade, US dollar-denominated, fixed-rate taxable bond market.
- The Bloomberg Barclay’s US Corporate High Yield Index, which covers the USD-denominated, non-investment grade, fixed-rate, taxable corporate bond market.
An index is a portfolio of specific securities, the performance of which is often used as a benchmark in judging the relative performance to certain asset classes. Index performance used throughout is intended to illustrate historical market trends and performance. Indexes are managed and do not incur investment management fees. An investor is unable to invest in an index. Their performance does not reflect the expenses associated with the management of an actual portfolio. No strategy assures success or protects against loss. There is no guarantee that a diversified portfolio will enhance overall returns or outperform a non-diversified portfolio. Diversification does not protect against market risk. All investing involves risk including loss of principal. Investing in stock includes numerous specific risks including: the fluctuation of dividend, loss of principal, and potential liquidity of the investment in a falling market. Past performance is no guarantee of future results.
Key Indicators
Key Indicators correspond to various macro-economic and rate-related data points that we consider impactful to equity markets.
- The US 10-Year Treasury Yield (%)/bps, is the return on investment for the U.S. government’s 10-year debt obligation and serves as a signal for investor confidence.
- SPDR Gold Trust Price ($), is an investment fund that reflects the performance on the price of a gold bullion, less the Trust’s expenses.
- West Texas Intermediate, which is an oil benchmark and the underlying asset in the New York Mercantile Exchange’s oil futures contract.
- CBOE Volatility Index (Level)/% Change, which uses price options on the S&P 500 to estimate the market's expectation of 30-day volatility.
General Disclosure
Wilbanks, Smith & Thomas Asset Management (WST) is an investment adviser registered under the Investment Advisers Act of 1940. Registration as an investment adviser does not imply any level of skill or training. The information presented in the material is general in nature and is not designed to address your investment objectives, financial situation or particular needs. Prior to making any investment decision, you should assess, or seek advice from a professional regarding whether any particular transaction is relevant or appropriate to your individual circumstances. This material is not intended to replace the advice of a qualified tax advisor, attorney, or accountant. Consultation with the appropriate professional should be done before any financial commitments regarding the issues related to the situation are made.
This document is intended for informational purposes only and should not be otherwise disseminated to other third parties. Past performance or results should not be taken as an indication or guarantee of future performance or results, and no representation or warranty, express or implied is made regarding future performance or results. This document does not constitute an offer to sell, or a solicitation of an offer to purchase, any security, future or other financial instrument or product. This material is proprietary and being provided on a confidential basis, and may not be reproduced, transferred or distributed in any form without prior written permission from WST. WST reserves the right at any time and without notice to change, amend, or cease publication of the information. The information contained herein includes information that has been obtained from third party sources and has not been independently verified. It is made available on an "as is" basis without warranty and does not represent the performance of any specific investment strategy.
Some of the information enclosed may represent opinions of WST and are subject to change from time to time and do not constitute a recommendation to purchase and sale any security nor to engage in any particular investment strategy. The information contained herein has been obtained from sources believed to be reliable but cannot be guaranteed for accuracy.
Besides attributed information, this material is proprietary and may not be reproduced, transferred or distributed in any form without prior written permission from WST. WST reserves the right at any time and without notice to change, amend, or cease publication of the information. This material has been prepared solely for informative purposes. The information contained herein may include information that has been obtained from third party sources and has not been independently verified. It is made available on an “as is” basis without warranty. This document is intended for clients for informational purposes only and should not be otherwise disseminated to other third parties. Past performance or results should not be taken as an indication or guarantee of future performance or results, and no representation or warranty, express or implied is made regarding future performance or results. This document does not constitute an offer to sell, or a solicitation of an offer to purchase, any security, future or other financial instrument or product.