
March 2022 | Global Equity Review
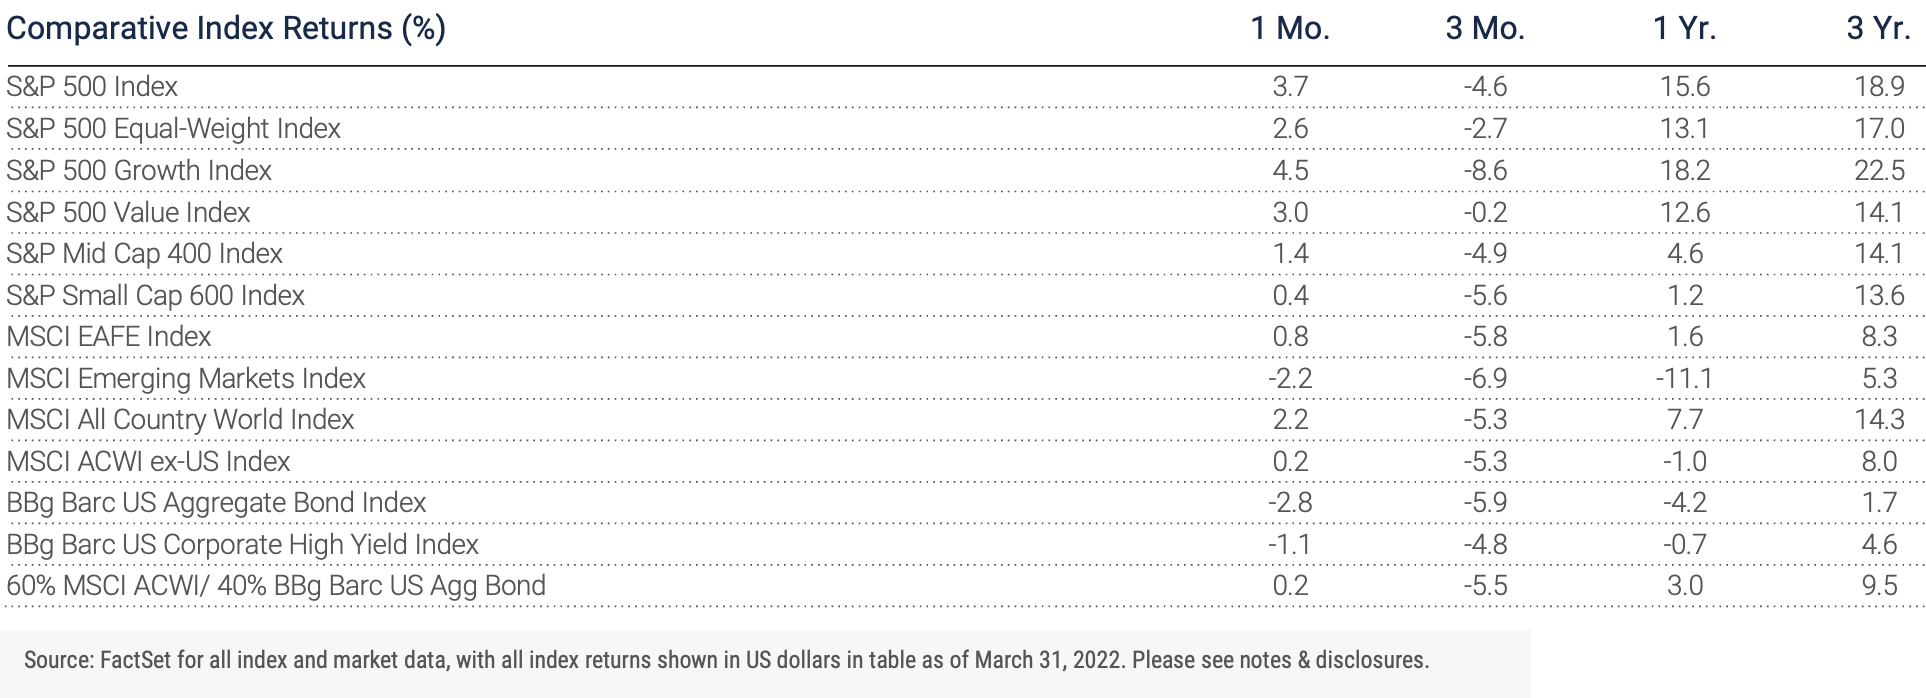
Equity markets initially followed the downward trajectory established in January and February before rallying off the early March lows to register the first monthly positive return during 2022. On a total-return basis, the S&P 500 registered a 3.7% gain, while the S&P 400 Mid Cap and S&P 600 Small Cap lagged with gains of 1.4% and 0.4% respectively. Cyclical sectors led the rebound off the month lows after lagging on the way down. For the month, cyclical sectors trailed more defensive segments of the market as investors would expect when economic concerns and inflation dominate the narrative. Value and growth styles were mixed during March with large cap growth outpacing large cap value, while in the mid and small cap segments value easily beat growth peers. Investor preference for dividends continued last month with stocks paying dividends of 2.50% or higher — clearly outpacing stocks paying no dividends. It is worth noting 30% of total market capitalization in the S&P 1500 Composite Index does not pay a dividend while over 55% pay either no dividend or offer a yield below 1.0%. If dividends remain in demand as we expect, this will favor value stocks which typically offer yields well above growth benchmarks.
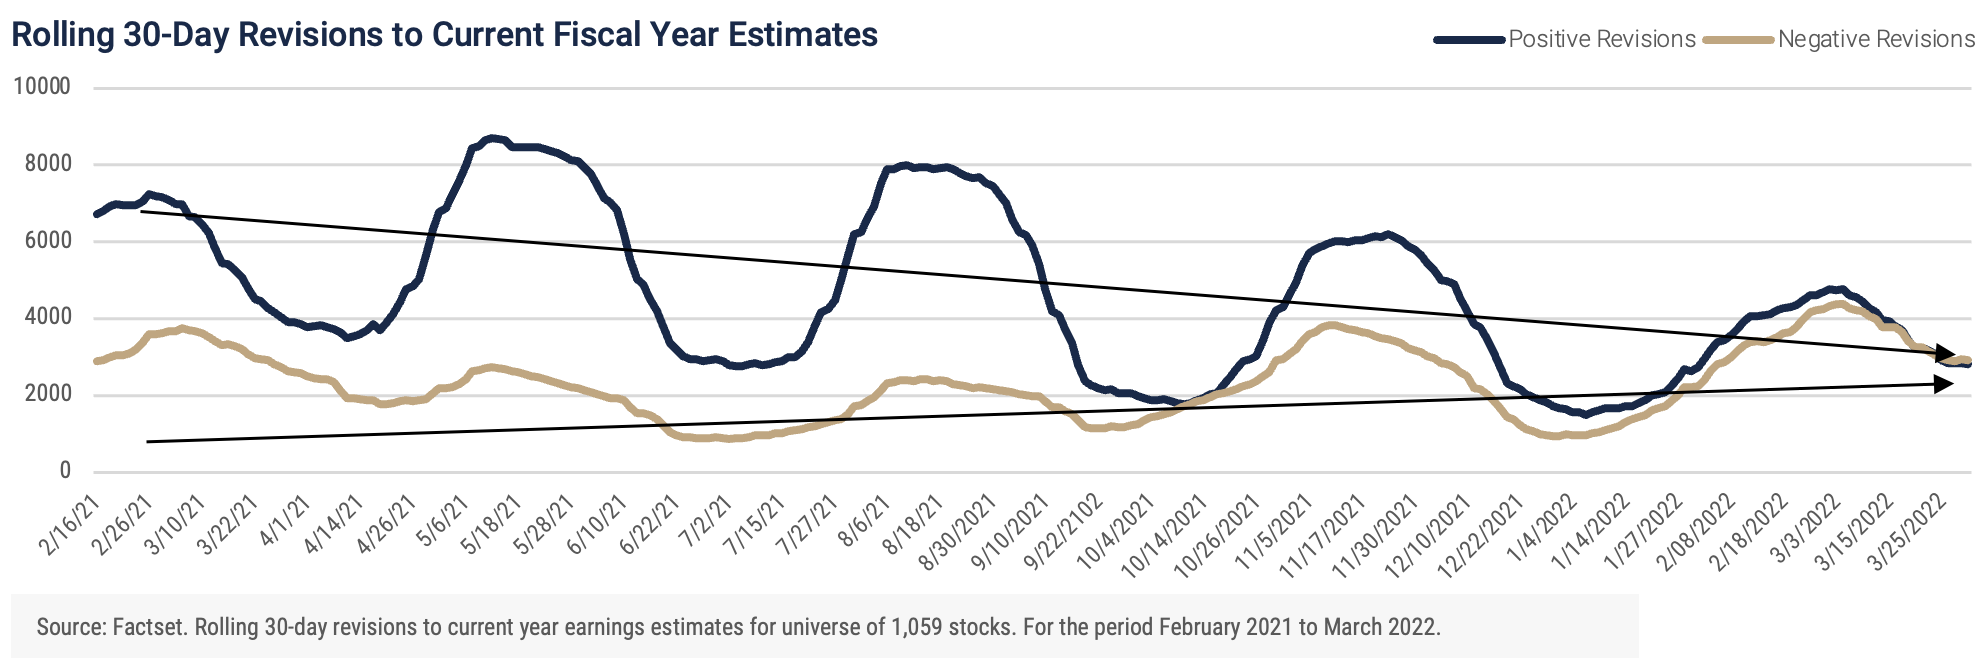
As we wrote in prior monthly reviews, the Federal Reserve indicated last December its resolve to bring down the current level of inflation back to its long-term target of 2.0% annually. This shift in monetary policy marks a significant reversal of a blustery tailwind for the economy and corporate profits to now a headwind of undetermined force. The removal of Federal Reserve actions as an ally of the equity market to a potential foe puts the burden on continued advances in stocks on important metrics like corporate earnings. Positive surprises to first-quarter earnings reports, as well as encouraging forward guidance from company managements, will be increasingly important in 2022. Company fundamentals will be a needed ballast to market volatility prompted by the less favorable direction of monetary policy as well as the heightened level of geopolitical risk. The chart below illustrates the percentage of total positive and negative revisions to current fiscal year earnings estimates over rolling 30-day periods through March 31st. The trend clearly shows positive revisions have moved lower in recent periods while negative revisions to earnings estimates have quickly closed the gap. This is not a forecast of lower earnings in 2022 as much as it is the absence of a positive force that pushed stocks higher last year. The ability of companies to continue to demonstrate earnings growth in the face of higher input costs will be a key trend to watch over the coming months.
Global equity markets returns lagged the U.S. in March. The S&P Global Market Index had a total return of 0.2% compared to 3.2% for the S&P Composite U.S. Index. Developed markets ex. the U.S. had a higher return than emerging markets at 1.1% versus -2.3% respectively. Weakness in emerging markets was notable in Eastern Europe and China. Regional strength was evident in Latin America which has rebounded strongly following an earlier period of weakness. Australia was also strongly benefitting from rising commodity prices. The dollar hampered non-U.S. returns as the currency rose 1.6% during the month due to a combination of rising U.S. rates and the conflict in Ukraine. As we commented last month, the total market capitalization outside the U.S. is roughly 40% while over 75% of the global economy exists outside the U.S. This asymmetric balance between equity markets and economic contribution argues for some exposure outside the U.S. Valuation, including dividends, also strongly suggests better opportunities overseas as well as central bank policies in key non-U.S. economies being more sensitive to tighter conditions from restrictive monetary policies during a period of heightened geopolitical risk.
Crosscurrents impacting equity markets have appeared and are in stark contrast to last year’s favorable environment of low inflation and interest rates, accompanied by strong earnings growth. A more challenging market environment is not a negative as much as it is a reinforcement long term strategic planning is vital to successfully traverse a less predictable landscape.
Notes & Disclosures
Index Returns – all shown in US dollars
All returns shown trailing 3/31/2022 for the period indicated. “YTD” refers to the total return as of prior-year end, while the other returns are annualized. 3-month and annualized returns are shown for:
- The S&P 500 index is comprised of large capitalized companies across many sectors and is generally regarded as representative of US stock market and is provided in this presentation in that regard only.
- The S&P 500® Equal Weight Index (EWI) is the equal-weight version of the widely-used S&P 500. The index includes the same constituents as the capitalization weighted S&P 500, but each company in the S&P 500 EWI is allocated a fixed weight - or 0.2% of the index total at each quarterly rebalance. The S&P 500 equal-weight index (S&P 500 EWI) series imposes equal weights on the index constituents included in the S&P 500 that are classified in the respective GICS® sector.
- The S&P 500 Growth Index is comprised of equities from the S&P 500 that exhibit strong growth characteristics and is weighted by market-capitalization.
- The S&P 500 Value Index is a market-capitalization weighted index comprising of equities from the S&P 500 that exhibit strong value characteristics such as book value to price ratio, cash flow to price ratio, sales to price ratio, and dividend yield.
- The Russell 3000 Index tracks the performance of 3000 U.S. corporations, determined by market-capitalization, and represents 98% of the investable equity market in the United States.
- The Russell Mid Cap Index measures the mid-cap segment performance of the U.S. equity market and is comprised of approximately 800 of the smallest securities based on current index membership and their market capitalization.
- The Russell 2000 Index is a market-capitalization weighted index that measures the performance of 2000 small-cap and mid-cap securities. The index was formulated to give investors an unbiased collection of the smallest tradable equities still meeting exchange listing requirements.
- The MSCI All Country World Index provides a measure of performance for the equity market throughout the world and is a free float-adjusted market capitalization weighted index.
- The MSCI EAFE Index is a market-capitalization weighted index and tracks the performance of small to large-cap equities in developed markets of Europe, Australasia, and the Far East.
- The MSCI Emerging Markets Index is a float-adjusted market-capitalization index that measures equity market performance in global emerging markets and cannot be purchased directly by investors.
- The S&P Global BMI sector indices are into sectors as defined by the widely used Global Industry Classification Standards (GICS) classifications. Each sector index comprises those companies included in the S&P Global BMI that are classified as members of respective GICS® sector. The S&P Global BMI Indices were introduced to provide a comprehensive benchmarking system for global equity investors. The S&P Global BMI is comprised of the S&P Emerging BMI and the S&P Developed BMI. It covers approximately 10,000 companies in 46 countries. To be considered for inclusion in the index, all listed stocks within the constituent country must have a float market capitalization of at least $100 million. For a country to be admitted, it must be politically stable and have legal property rights and procedures, among other criteria.
- The Barclay’s US Aggregate Index, a broad-based unmanaged bond index that is generally considered to be representative of the performance of the investment grade, US dollar-denominated, fixed-rate taxable bond market.
- The Bloomberg Barclay’s US Corporate High Yield Index, which covers the USD-denominated, non-investment grade, fixed-rate, taxable corporate bond market.
An index is a portfolio of specific securities, the performance of which is often used as a benchmark in judging the relative performance to certain asset classes. Index performance used throughout is intended to illustrate historical market trends and performance. Indexes are managed and do not incur investment management fees. An investor is unable to invest in an index. Their performance does not reflect the expenses associated with the management of an actual portfolio. No strategy assures success or protects against loss. There is no guarantee that a diversified portfolio will enhance overall returns or outperform a non-diversified portfolio. Diversification does not protect against market risk. All investing involves risk including loss of principal. Investing in stock includes numerous specific risks including: the fluctuation of dividend, loss of principal, and potential liquidity of the investment in a falling market. Past performance is no guarantee of future results.
Key Indicators
Key Indicators correspond to various macro-economic and rate-related data points that we consider impactful to equity markets.
- The US 10-Year Treasury Yield (%)/bps, is the return on investment for the U.S. government’s 10-year debt obligation and serves as a signal for investor confidence.
- SPDR Gold Trust Price ($), is an investment fund that reflects the performance on the price of a gold bullion, less the Trust’s expenses.
- West Texas Intermediate, which is an oil benchmark and the underlying asset in the New York Mercantile Exchange’s oil futures contract.
- CBOE Volatility Index (Level)/% Change, which uses price options on the S&P 500 to estimate the market's expectation of 30-day volatility.
General Disclosure
Wilbanks, Smith & Thomas Asset Management (WST) is an investment adviser registered under the Investment Advisers Act of 1940. Registration as an investment adviser does not imply any level of skill or training. The information presented in the material is general in nature and is not designed to address your investment objectives, financial situation or particular needs. Prior to making any investment decision, you should assess, or seek advice from a professional regarding whether any particular transaction is relevant or appropriate to your individual circumstances. This material is not intended to replace the advice of a qualified tax advisor, attorney, or accountant. Consultation with the appropriate professional should be done before any financial commitments regarding the issues related to the situation are made.
This document is intended for informational purposes only and should not be otherwise disseminated to other third parties. Past performance or results should not be taken as an indication or guarantee of future performance or results, and no representation or warranty, express or implied is made regarding future performance or results. This document does not constitute an offer to sell, or a solicitation of an offer to purchase, any security, future or other financial instrument or product. This material is proprietary and being provided on a confidential basis, and may not be reproduced, transferred or distributed in any form without prior written permission from WST. WST reserves the right at any time and without notice to change, amend, or cease publication of the information. The information contained herein includes information that has been obtained from third party sources and has not been independently verified. It is made available on an "as is" basis without warranty and does not represent the performance of any specific investment strategy.
Some of the information enclosed may represent opinions of WST and are subject to change from time to time and do not constitute a recommendation to purchase and sale any security nor to engage in any particular investment strategy. The information contained herein has been obtained from sources believed to be reliable but cannot be guaranteed for accuracy.
Besides attributed information, this material is proprietary and may not be reproduced, transferred or distributed in any form without prior written permission from WST. WST reserves the right at any time and without notice to change, amend, or cease publication of the information. This material has been prepared solely for informative purposes. The information contained herein may include information that has been obtained from third party sources and has not been independently verified. It is made available on an “as is” basis without warranty. This document is intended for clients for informational purposes only and should not be otherwise disseminated to other third parties. Past performance or results should not be taken as an indication or guarantee of future performance or results, and no representation or warranty, express or implied is made regarding future performance or results. This document does not constitute an offer to sell, or a solicitation of an offer to purchase, any security, future or other financial instrument or product.