
July 2023 | Fixed Income Markets Review
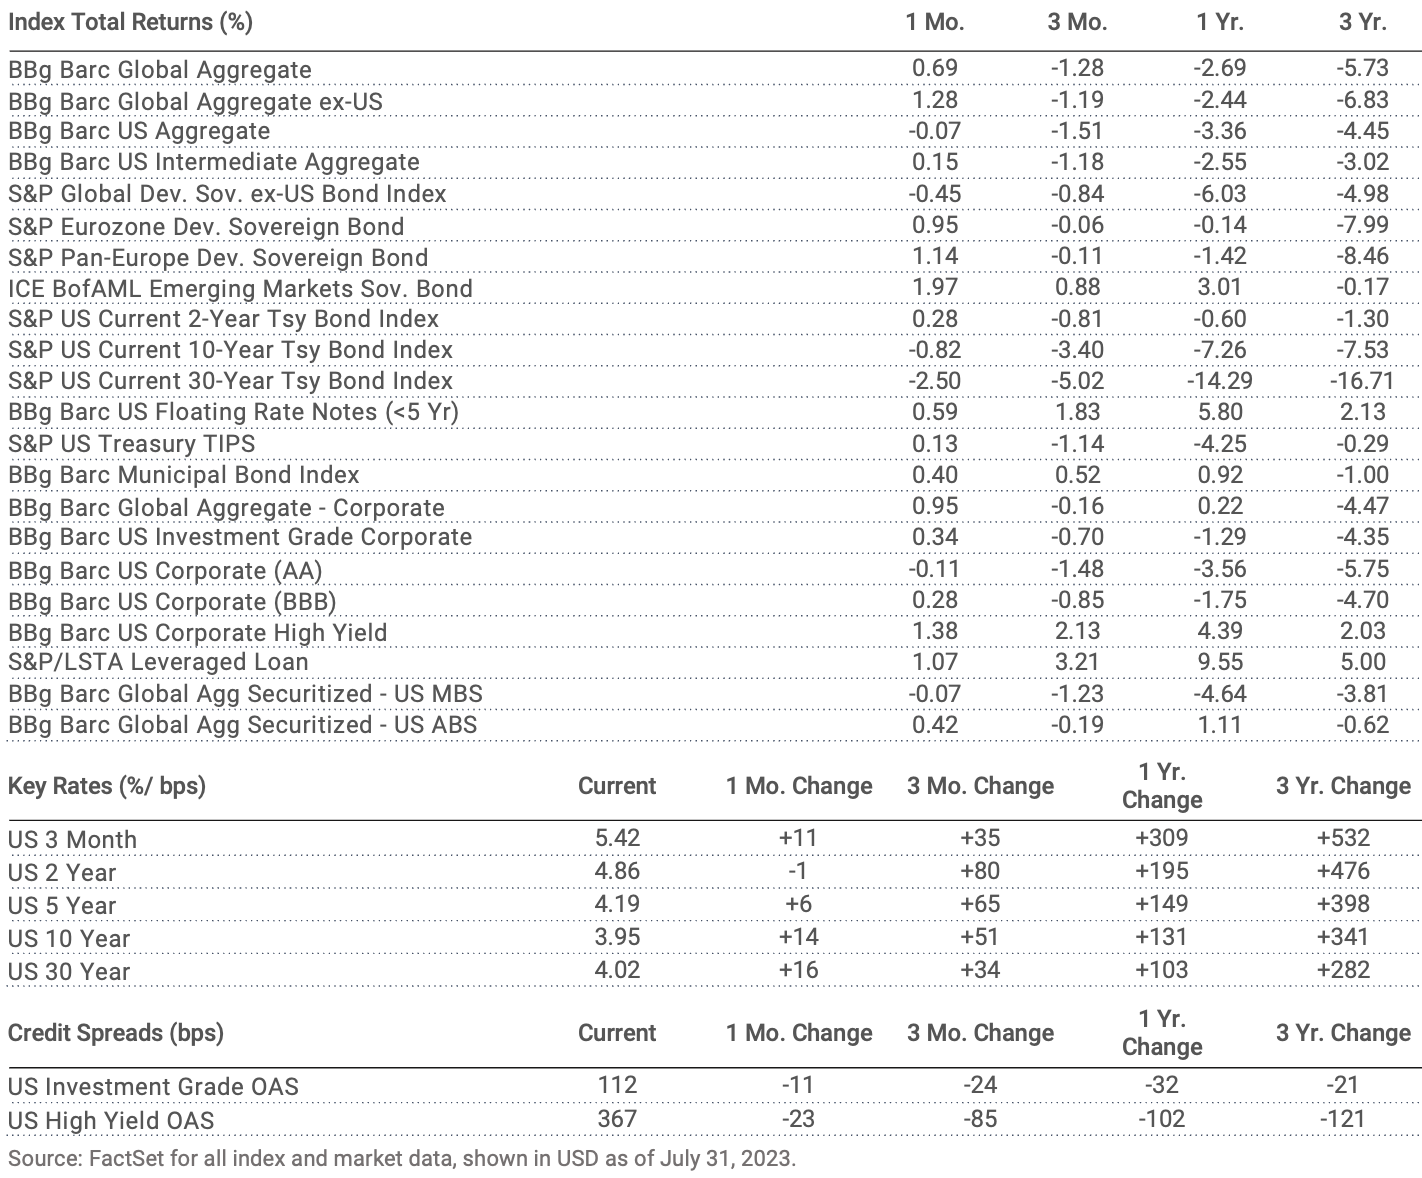
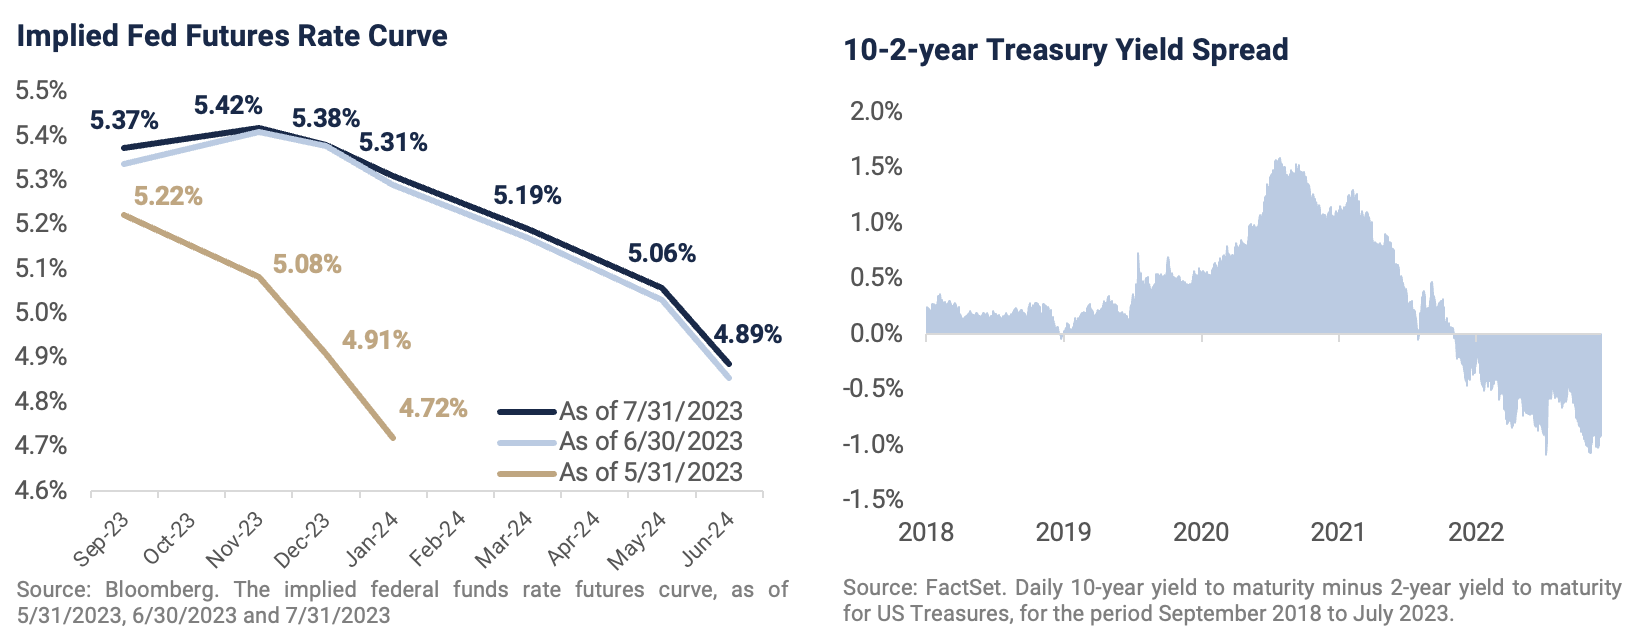
Global fixed income markets were largely positive in July amid the Bloomberg Barclays US Aggregate Bond Index returning -0.07%. Investors witnessed modest increases to the short- and long-term yields along the Treasury curve. The yield for on-the-run 10-year Treasuries peaked intra-month at 4.05% before declining to finish the period at 3.95%. The recent rate dynamics have led to a slight steepening along the yield curve when measured by the 10-2 year spread. However, the curve remains considerably inverted as the 10-2 year spread was -90 bps to close July. The last time this spread measure was positive was July 2022, amid the early innings of the current Fed tightening cycle. Other notable fixed income trends during the month included mild declines to investment grade credit spreads, high yield credit spreads, and inflation breakevens.
At the July FOMC meeting, the Fed implemented another 25 bps hike to the policy rate – a move widely expected by market participants — resulting in the target range increasing to 5.25–5.50% and marking the highest level in 22 years for the federal funds rate. Chairman Powell reiterated how future policy decisions will be largely data-dependent as they aim for price stability. Several economic reports will be released prior to the next FOMC meeting in mid-September and will help inform monetary policy measures going forward. Currently, the futures market is pricing in an 86% probability of the FOMC holding rates as steady as in June. Futures traders anticipate no further changes to the policy rate in 2023 while it remains above 5% well into 2024. The implied fed futures curve predicts rates moving lower next year, but the hawkish rhetoric from the Fed has had a notable impact on expectations since the end of May. As shown below, the curve has moved considerably higher in the past two months as market participants have embraced the ‘higher for longer’ mantra.
The credit rating agency Fitch downgraded the US from AAA to AA+ surprising market participants. Fitch had put the nation on ratings watch in May as the debt ceiling negotiations were underway. Although the US government ultimately increased the debt ceiling limit, the rating agency elected to proceed with the downgrade, flagging expected fiscal deterioration in the coming years, the increasing sovereign debt burden, and governance issues. However, the initial market reaction to this event has been muted as Fitch did not adjust the country’s rating ceiling. Such a move may have adversely affected other AAA-rated securities issued by US entities such as GSE and municipal debt obligations.
Notes & Disclosures
Index Returns – all shown in US dollars
All returns shown trailing 7/31/2023 for the period indicated. “YTD” refers to the total return as of prior-year end, while the other returns are annualized. 3-month and annualized returns are shown for:
- The Barclay’s US Aggregate Index, a broad-based unmanaged bond index that is generally considered to be representative of the performance of the investment grade, US dollar-denominated, fixed-rate taxable bond market.
- The ICE BofAML Emerging Markets Sovereign Bond Index is a subset of The BofA Merrill Lynch World Sovereign Bond Index excluding all securities with a country of risk that is a member of the FX G10, all Western European countries, and territories of the U.S. and Western European countries. The FX G10 includes all Euro members, the U.S., Japan, the U.K., Canada, Australia, New Zealand, Switzerland, Norway, and Sweden.
- The Bloomberg Barclays Global Aggregate Index, which measures global investment grade debt from twenty-four local currency markets. This multi-currency benchmark includes treasury, government-related, corporate and securitized fixed-rate bonds from both developed and emerging markets issuers.
- The S&P Global Developed Sovereign Bond index includes local-currency denominated debt publicly issued by governments in their domestic markets.
- S&P Eurozone Developed Sovereign Bond - seeks to measure the performance of Eurozone government bonds.
- The S&P Pan-Europe Developed Sovereign Bond Index is a comprehensive, market-value-weighted index designed to track the performance of local currency-denominated securities publicly issued by Denmark, Norway, Sweden, Switzerland, the U.K. and developed countries in the Eurozone for their domestic markets.
- ICE BofAML Emerging Markets Sovereign Bond - tracks the performance of US dollar (USD) and Euro denominated emerging markets non-sovereign debt publicly issued within the major domestic and Eurobond markets.
- The Bloomberg Barclay’s US Corporate Bond Index (AA), which measures the investment grade, fixed-rate, taxable corporate bond market. It includes USD denominated securities publicly issued by US and non-US industrial, utility and financial issuers.
- The Bloomberg Barclay’s US Corporate High Yield Index, which covers the USD-denominated, non-investment grade, fixed-rate, taxable corporate bond market.
- Bloomberg Barclay’s Global Aggregate Securitized- US Mortgage-Backed Securities, which is a component of the Bloomberg Barclay’s US Aggregate Index and measures investment grade mortgage backed pass-through securities of GNMA, FNMA, and FHLMC.
- Bloomberg Barclay’s Global Aggregate Securitized- US Asset-Backed Securities, which is a component of the Bloomberg Barclay’s US Aggregate Index and includes the pass-throughs, bullets, and controlled amortization structures of only the senior class of ABS issues.
- The Blomberg Barclay’s US Floating Rate Notes (<5 Yr) Index, measures the performance of U.S dollar-dominated, investment grade floating rate notes with maturities less than 5 years.
- The Bloomberg Barclay’s Municipal Bond Index, which measures investment grade, tax-exempt bonds with a maturity of at least one year.
- The S&P/ LSTA Leveraged Loan Index is designed to reflect the performance of the largest facilities in the leveraged loan market.
An index is a portfolio of specific securities, the performance of which is often used as a benchmark in judging the relative performance to certain asset classes. Index performance used throughout is intended to illustrate historical market trends and performance. Indexes are managed and do not incur investment management fees. An investor is unable to invest in an index. Their performance does not reflect the expenses associated with the management of an actual portfolio. No strategy assures success or protects against loss. There is no guarantee that a diversified portfolio will enhance overall returns or outperform a non-diversified portfolio. Diversification does not protect against market risk. All investing involves risk including loss of principal. Investing in stock includes numerous specific risks including: the fluctuation of dividend, loss of principal, and potential liquidity of the investment in a falling market. Past performance is no guarantee of future results.
Key Rates
Key Rates are shown for US Treasuries and London Interbank Offered Rate (LIBOR), the interest rate at which banks offer to lend funds (wholesale money) to one another in the international interbank market. LIBOR is a key benchmark rate that reflects how much it costs banks to borrow from each other. “Current” refers to the percentage rate as of 2/28/2023, while the rates of change are stated in basis points.
Credit Spreads
Credit Spreads shown comprise the Option-Adjusted Spread of the indices indicated, versus the US 10-Year Treasury Yield. “Current” refers to the spread as of 2/28/2023, while the rates of change are stated in basis points.
Key Indicators
Key Indicators correspond to various macro-economic and rate-related data points that we consider impactful to fixed income markets.
- 2s10s (bps)/ 10 Yr vs 2 Yr Treasury Spread, which measures the difference between yields on 10-Year Treasury Constant Maturity Securities and 2-Year Treasury Constant Maturity Securities.
- West Texas Intermediate, which is an oil benchmark and the underlying asset in the New York Mercantile Exchange’s oil futures contract.
- Core Consumer Price Index, which measures the consumer price index excluding food and energy prices. Shown as of the prior month-end.
- Breakeven Inflation: 5 Yr %/ bps, which uses a moving 30-day average of the 5-Year Treasury Constant Maturity Securities and 5-Year Treasury Inflation–Indexed Constant Maturity Securities to derive expected inflation.
- Breakeven Inflation: 10 Yr %/ bps, which uses a moving 30-day average of the 10-Year Treasury Constant Maturity Securities and 10-Year Treasury Inflation–Indexed Constant Maturity Securities to derive expected inflation.
General Disclosure
Wilbanks, Smith & Thomas Asset Management (WST) is an investment adviser registered under the Investment Advisers Act of 1940. Registration as an investment adviser does not imply any level of skill or training. The information presented in the material is general in nature and is not designed to address your investment objectives, financial situation or particular needs. Prior to making any investment decision, you should assess, or seek advice from a professional regarding whether any particular transaction is relevant or appropriate to your individual circumstances. This material is not intended to replace the advice of a qualified tax advisor, attorney, or accountant. Consultation with the appropriate professional should be done before any financial commitments regarding the issues related to the situation are made.
This document is intended for informational purposes only and should not be otherwise disseminated to other third parties. Past performance or results should not be taken as an indication or guarantee of future performance or results, and no representation or warranty, express or implied is made regarding future performance or results. This document does not constitute an offer to sell, or a solicitation of an offer to purchase, any security, future or other financial instrument or product. This material is proprietary and being provided on a confidential basis, and may not be reproduced, transferred or distributed in any form without prior written permission from WST. WST reserves the right at any time and without notice to change, amend, or cease publication of the information. The information contained herein includes information that has been obtained from third party sources and has not been independently verified. It is made available on an "as is" basis without warranty and does not represent the performance of any specific investment strategy.
Some of the information enclosed may represent opinions of WST and are subject to change from time to time and do not constitute a recommendation to purchase and sale any security nor to engage in any particular investment strategy. The information contained herein has been obtained from sources believed to be reliable but cannot be guaranteed for accuracy.
Besides attributed information, this material is proprietary and may not be reproduced, transferred or distributed in any form without prior written permission from WST. WST reserves the right at any time and without notice to change, amend, or cease publication of the information. This material has been prepared solely for informative purposes. The information contained herein may include information that has been obtained from third party sources and has not been independently verified. It is made available on an “as is” basis without warranty. This document is intended for clients for informational purposes only and should not be otherwise disseminated to other third parties. Past performance or results should not be taken as an indication or guarantee of future performance or results, and no representation or warranty, express or implied is made regarding future performance or results. This document does not constitute an offer to sell, or a solicitation of an offer to purchase, any security, future or other financial instrument or product.