
July 2022 | Global Equity Markets Review
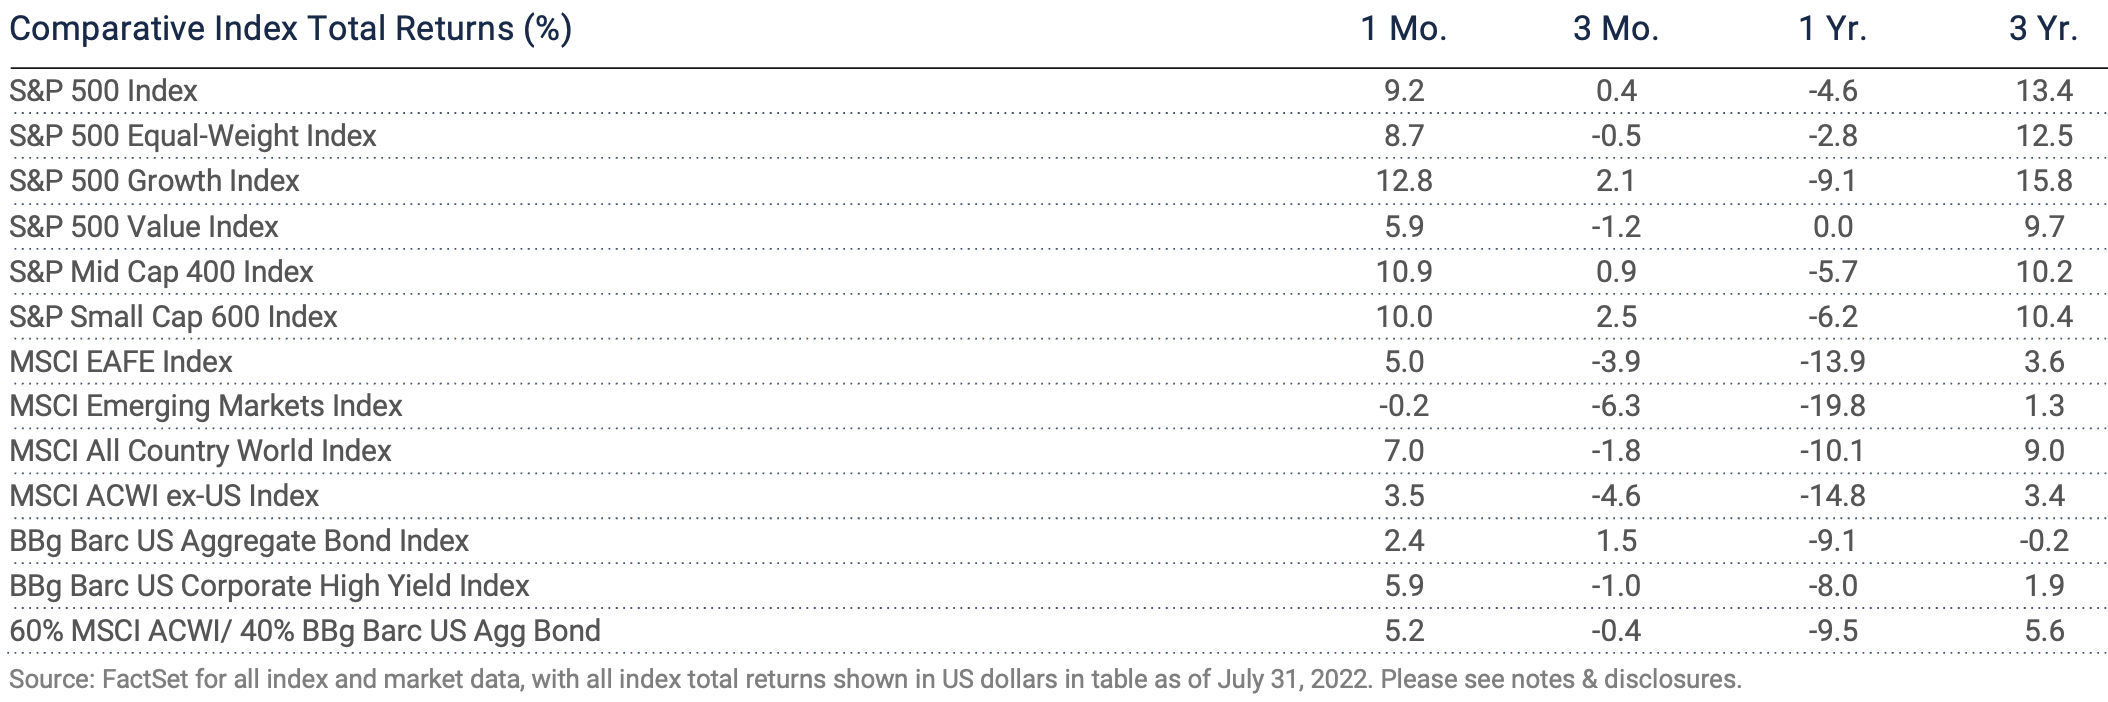
The stock market bounced back strongly in July after a weak June. The S&P 500 registered a 9.2% total return which was the best return since November 2020. The S&P 400 Mid Cap and S&P 600 Small Cap performed better at 10.9% and 10.0%, respectively. Growth stocks recovered from extreme losses year-to-date in part due to easing of interest rates which impacts valuations more so than the rest of the market. The meaningful drop in rates, as measured by the ten-year Treasury, buoyed the overall market and provided an important catalyst to investor sentiment which had declined to cycle lows. Cyclical stocks outpaced non-cyclicals as investors shifted their focus past the current pace of Federal Reserve rate hikes and hawkish comments by FOMC voting members. Second quarter earnings were also better than feared, although estimates are being recalibrated lower due to evidence of a slowing economy and input costs which remain stubbornly high across many industries.
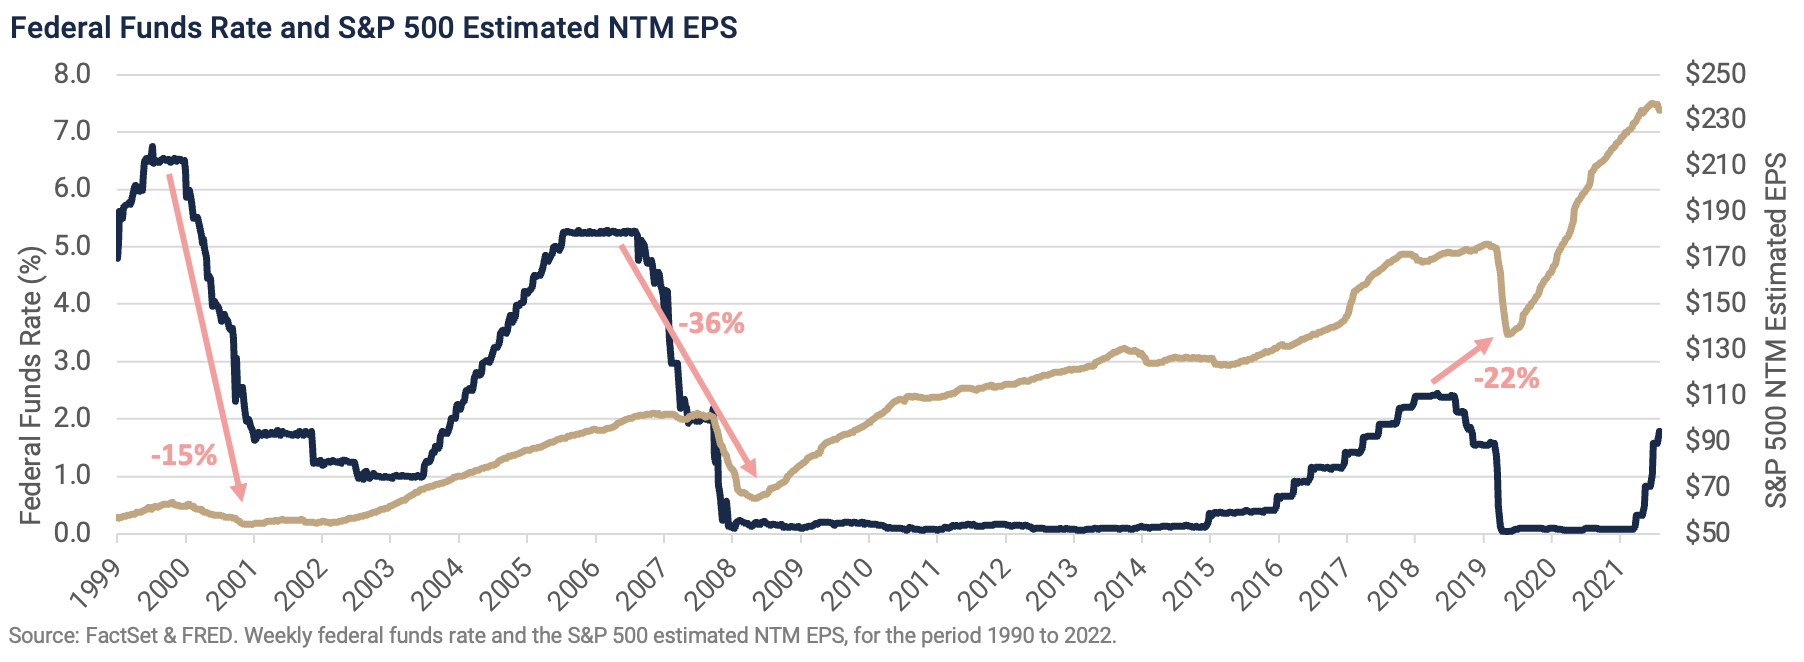
The impressive rally in the S&P 500 in July followed an almost equally weak month in June (-8.3%). Back-to-back reversals of this magnitude are unusual. Since 1960, the S&P 500 declined by 6% or worse followed by a rally of 6% or higher eleven previous times. An analysis of returns 3 and 6 months past the inflection points suggest above average returns ahead. However, the common thread tying together earlier patterns is the Federal Reserve was accommodative in monetary policy and lowering short term rates. The only exception was the reversal in December 2018 and January 2019 where the federal funds rate was not lowered until August 2019. Monetary policy currently is on a different path of raising short term interest rates and shrinking their $9 trillion balance sheet. The resolve to bring down inflation is strong and being repeated often by FOMC officials. It is unlikely we see the Fed lower rates until well into 2023 and then only after the central bank is convinced inflation is trending back to their long-term target of 2.0% annually.
Evidence is mounting of a slowing economy and combined with a restrictive monetary policy is suggestive of a risk to corporate earnings which to date have held up remarkably well. As the below chart illustrates, estimates have not troughed in previous major earnings cycles until after the Federal Reserve cut rates.
Global developed equity markets followed the U.S. lead with good but less impressive results in July. The S&P Developed ex-U.S. Index had a total return of 5.3% last month while the S&P Emerging Index declined by -0.4%. Areas of strength in developed markets were more focused in Northern Europe along with developed markets Asia. Emerging market indexes were dragged lower mostly by China which had until recently been an above average performer. The dollar in July increased 1.2% for the month and diminished the returns for U.S. investors. Since the end of 2020, the dollar is up 17.4% and has risen in 13 of the past 19 months which would be one of the strongest positive momentum periods since 1985. Near term strength in the currency is due in part to the Fed’s aggressive stance on raising short term interest rates faster than other central banks in response to stronger economic activity in the U.S. versus the rest of the world.
Despite stronger headwinds near term for non-U.S. economies, the market arguably has priced in the higher level of uncertainty. When viewing the ratio of valuation on next twelve months earnings estimates between the S&P 500 and EAFE indices, the current ratio is approaching a 20-year low in favor of non-U.S. markets and suggestive of a contrary opportunity off a low base of expectations. While positive fundamentals may remain elusive in the coming months, the rebound of the U.S. market off the mid-June low illustrates how quickly sour sentiment can turn more constructive and produce a sharp reversal in markets.
Notes & Disclosures
Index Returns – all shown in US dollars
All returns shown trailing 7/31/2022 for the period indicated. “YTD” refers to the total return as of prior-year end, while the other returns are annualized. 3-month and annualized returns are shown for:
- The S&P 500 index is comprised of large capitalized companies across many sectors and is generally regarded as representative of US stock market and is provided in this presentation in that regard only.
- The S&P 500® Equal Weight Index (EWI) is the equal-weight version of the widely-used S&P 500. The index includes the same constituents as the capitalization weighted S&P 500, but each company in the S&P 500 EWI is allocated a fixed weight - or 0.2% of the index total at each quarterly rebalance. The S&P 500 equal-weight index (S&P 500 EWI) series imposes equal weights on the index constituents included in the S&P 500 that are classified in the respective GICS® sector.
- The S&P 500 Growth Index is comprised of equities from the S&P 500 that exhibit strong growth characteristics and is weighted by market-capitalization.
- The S&P 500 Value Index is a market-capitalization weighted index comprising of equities from the S&P 500 that exhibit strong value characteristics such as book value to price ratio, cash flow to price ratio, sales to price ratio, and dividend yield.
- The Russell 3000 Index tracks the performance of 3000 U.S. corporations, determined by market-capitalization, and represents 98% of the investable equity market in the United States.
- The Russell Mid Cap Index measures the mid-cap segment performance of the U.S. equity market and is comprised of approximately 800 of the smallest securities based on current index membership and their market capitalization.
- The Russell 2000 Index is a market-capitalization weighted index that measures the performance of 2000 small-cap and mid-cap securities. The index was formulated to give investors an unbiased collection of the smallest tradable equities still meeting exchange listing requirements.
- The MSCI All Country World Index provides a measure of performance for the equity market throughout the world and is a free float-adjusted market capitalization weighted index.
- The MSCI EAFE Index is a market-capitalization weighted index and tracks the performance of small to large-cap equities in developed markets of Europe, Australasia, and the Far East.
- The MSCI Emerging Markets Index is a float-adjusted market-capitalization index that measures equity market performance in global emerging markets and cannot be purchased directly by investors.
- The S&P Global BMI sector indices are into sectors as defined by the widely used Global Industry Classification Standards (GICS) classifications. Each sector index comprises those companies included in the S&P Global BMI that are classified as members of respective GICS® sector. The S&P Global BMI Indices were introduced to provide a comprehensive benchmarking system for global equity investors. The S&P Global BMI is comprised of the S&P Emerging BMI and the S&P Developed BMI. It covers approximately 10,000 companies in 46 countries. To be considered for inclusion in the index, all listed stocks within the constituent country must have a float market capitalization of at least $100 million. For a country to be admitted, it must be politically stable and have legal property rights and procedures, among other criteria.
- The Barclay’s US Aggregate Index, a broad-based unmanaged bond index that is generally considered to be representative of the performance of the investment grade, US dollar-denominated, fixed-rate taxable bond market.
- The Bloomberg Barclay’s US Corporate High Yield Index, which covers the USD-denominated, non-investment grade, fixed-rate, taxable corporate bond market.
An index is a portfolio of specific securities, the performance of which is often used as a benchmark in judging the relative performance to certain asset classes. Index performance used throughout is intended to illustrate historical market trends and performance. Indexes are managed and do not incur investment management fees. An investor is unable to invest in an index. Their performance does not reflect the expenses associated with the management of an actual portfolio. No strategy assures success or protects against loss. There is no guarantee that a diversified portfolio will enhance overall returns or outperform a non-diversified portfolio. Diversification does not protect against market risk. All investing involves risk including loss of principal. Investing in stock includes numerous specific risks including: the fluctuation of dividend, loss of principal, and potential liquidity of the investment in a falling market. Past performance is no guarantee of future results.
Key Indicators
Key Indicators correspond to various macro-economic and rate-related data points that we consider impactful to equity markets.
- The US 10-Year Treasury Yield (%)/bps, is the return on investment for the U.S. government’s 10-year debt obligation and serves as a signal for investor confidence.
- SPDR Gold Trust Price ($), is an investment fund that reflects the performance on the price of a gold bullion, less the Trust’s expenses.
- West Texas Intermediate, which is an oil benchmark and the underlying asset in the New York Mercantile Exchange’s oil futures contract.
- CBOE Volatility Index (Level)/% Change, which uses price options on the S&P 500 to estimate the market's expectation of 30-day volatility.
General Disclosure
Wilbanks, Smith & Thomas Asset Management (WST) is an investment adviser registered under the Investment Advisers Act of 1940. Registration as an investment adviser does not imply any level of skill or training. The information presented in the material is general in nature and is not designed to address your investment objectives, financial situation or particular needs. Prior to making any investment decision, you should assess, or seek advice from a professional regarding whether any particular transaction is relevant or appropriate to your individual circumstances. This material is not intended to replace the advice of a qualified tax advisor, attorney, or accountant. Consultation with the appropriate professional should be done before any financial commitments regarding the issues related to the situation are made.
This document is intended for informational purposes only and should not be otherwise disseminated to other third parties. Past performance or results should not be taken as an indication or guarantee of future performance or results, and no representation or warranty, express or implied is made regarding future performance or results. This document does not constitute an offer to sell, or a solicitation of an offer to purchase, any security, future or other financial instrument or product. This material is proprietary and being provided on a confidential basis, and may not be reproduced, transferred or distributed in any form without prior written permission from WST. WST reserves the right at any time and without notice to change, amend, or cease publication of the information. The information contained herein includes information that has been obtained from third party sources and has not been independently verified. It is made available on an "as is" basis without warranty and does not represent the performance of any specific investment strategy.
Some of the information enclosed may represent opinions of WST and are subject to change from time to time and do not constitute a recommendation to purchase and sale any security nor to engage in any particular investment strategy. The information contained herein has been obtained from sources believed to be reliable but cannot be guaranteed for accuracy.
Besides attributed information, this material is proprietary and may not be reproduced, transferred or distributed in any form without prior written permission from WST. WST reserves the right at any time and without notice to change, amend, or cease publication of the information. This material has been prepared solely for informative purposes. The information contained herein may include information that has been obtained from third party sources and has not been independently verified. It is made available on an “as is” basis without warranty. This document is intended for clients for informational purposes only and should not be otherwise disseminated to other third parties. Past performance or results should not be taken as an indication or guarantee of future performance or results, and no representation or warranty, express or implied is made regarding future performance or results. This document does not constitute an offer to sell, or a solicitation of an offer to purchase, any security, future or other financial instrument or product.