
January 2020: Fixed Income Market Review
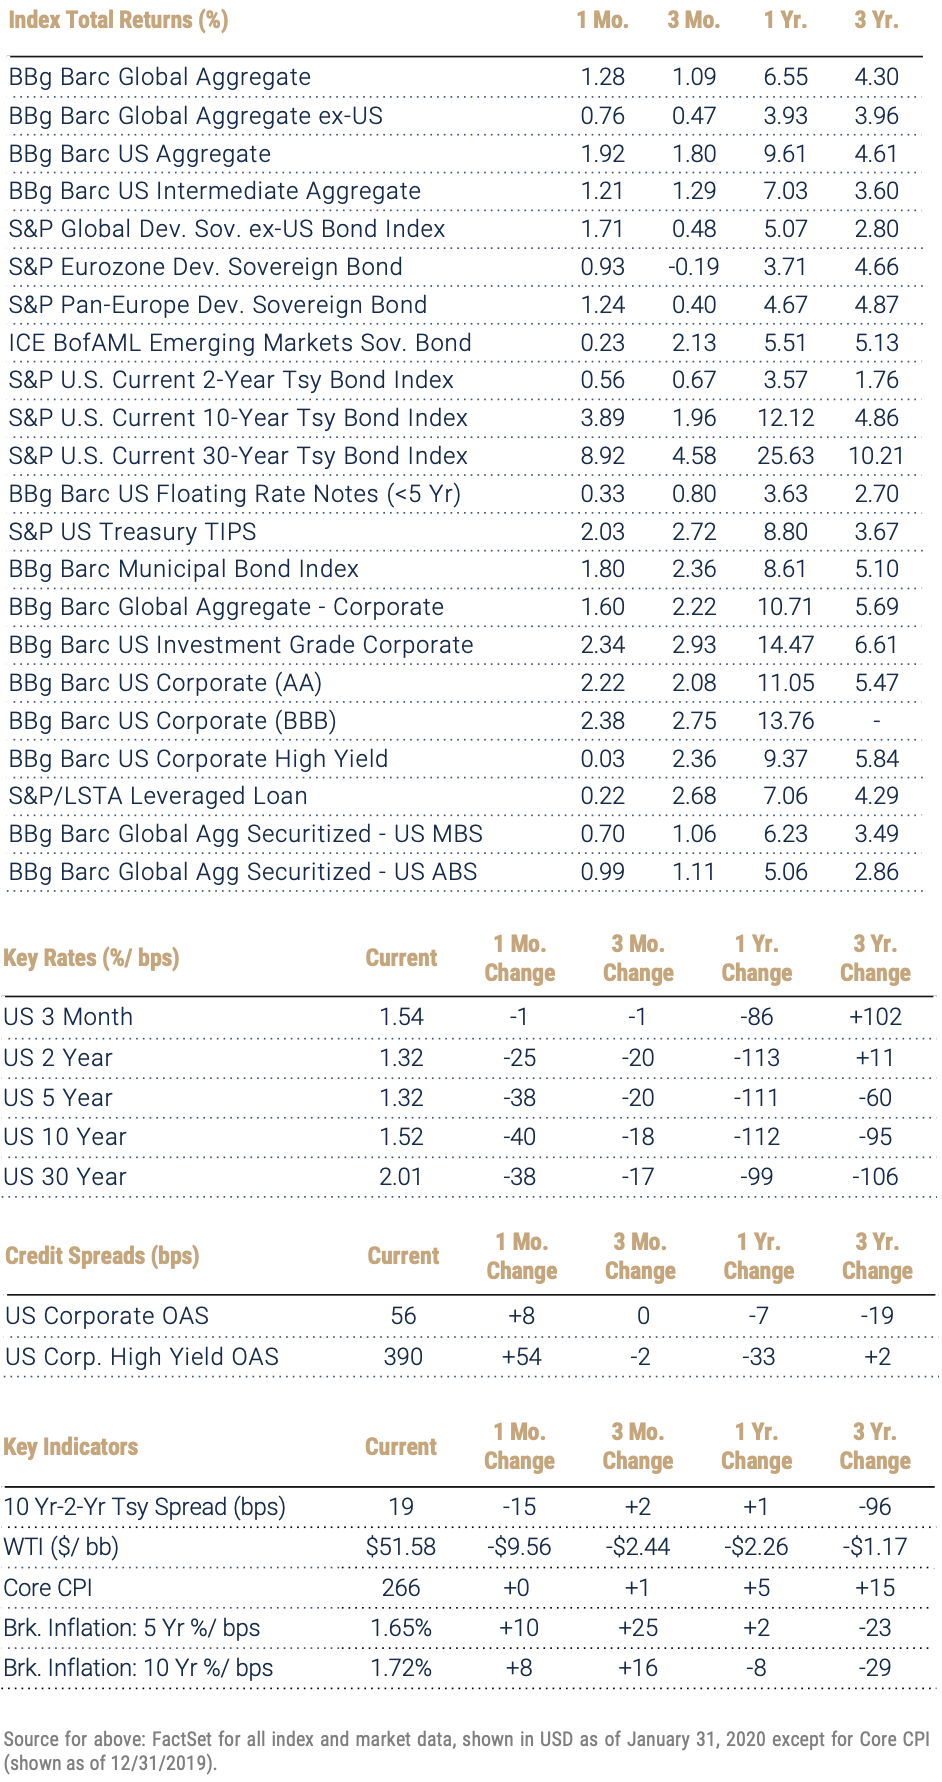
After 4Q’s economic and political positives wilted global bond momentum, chaotic January events and headlines restored the shine to safe-haven assets and fixed income overall. Global bonds as measured by the Bloomberg Barclays Global Aggregate Index added 1.28% for the month, led by a US Aggregate up 1.92%. There were no losers among major indices and markets, although investors favored duration and quality and the riskiest credits were just barely positive.
In isolation, any of January’s major headlines – open threats of war and acts of aggression between nuclear powers, a US presidential impeachment proceeding and an emerging pandemic – would seem sufficient to rattle risk-asset markets and rally bond markets. Investors were resilient, however, shaking off US-Iran tensions just as quickly as the situation de-escalated and overall appearing indifferent to political drama in the US. Markets did react, however, with increasing alarm as news of the coronavirus broke and escalated in the back half of the month.
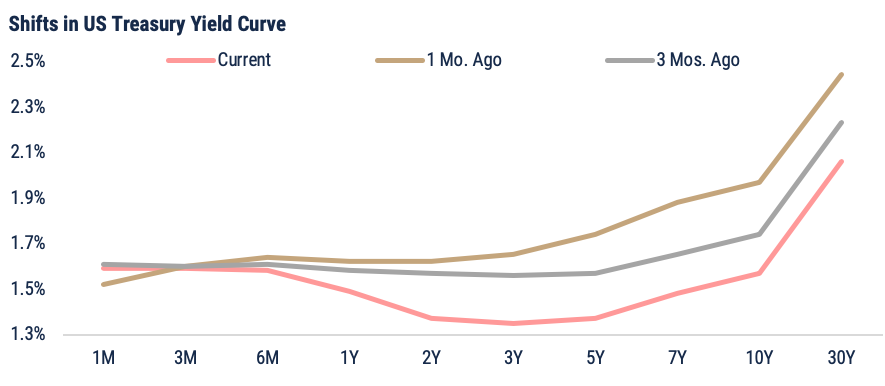
While global bond prices rallied almost uniformly, US rates-market assets (i.e., Treasuries and securitized) drove the story overall. Yields fell roughly 40 basis points across 30-, 10-, 7- and 5-year issues, resulting in a significant downward shift in the curve. T-bills held steady, prompting a re-inversion of the short and intermediate segments; this technical re-occurrence (of an indicator historically viewed as a harbinger of recession) weighed against a still-solid footing for the US economy and upside implied by progress on the US-China trade conflict via the signing of the Phase One deal. US investment-grade corporates posted a gain of 2.34%, with the biggest return posted by the highest-duration/ highest-quality segment (AAA-rated bonds, also by far the smallest investment-grade population of issues). The BBB-segment – by far the largest constituency in investment-grade – drove most of the index return. High yield, meanwhile, was spared the pullback that occurred in most riskier assets but was essentially flat for the month as slack materialized via a modest decline in the CCC-segment (which rallied massively in 4Q after lagging for most of 2019).
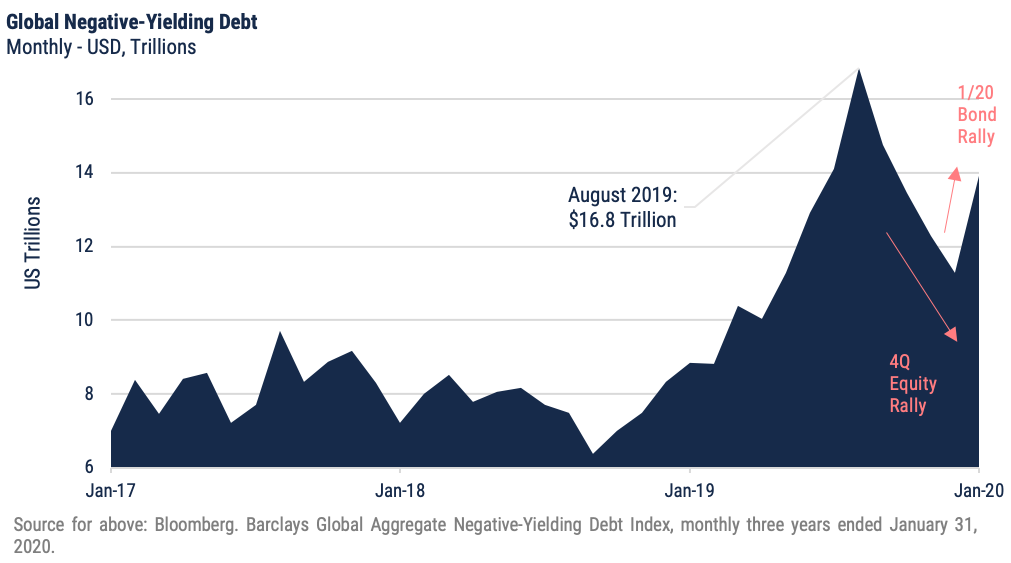
Outside the US, sovereigns and credits alike rallied, but the impacts of dollar strengthening blunted total returns; Japanese issues were the one exception, benefitting from a slight edge to the Yen. The Global Aggregate ex-US (which captures investment-grade, local-currency denominated issues) added 1.28%, and the share of negative-yielding global debt ticked up from roughly $11 trillion at the end of 2019 to $14 trillion at month-end – still below the record $16 trillion notched at the peak of the bond-market rally, in August 2019. Emerging sovereigns were positive (+0.23%) but only modestly so, as currency impacts were particularly challenging for issuers such as Brazil and South Africa and a dip in oil price was further unsupportive to certain emerging economies.
Important Disclosures
Index Returns – all shown in US dollars
All returns shown trailing 1/31/2020 for the period indicated. “YTD” refers to the total return as of prior-year end, while the other returns are annualized. 3-month and annualized returns are shown for:
- The Barclay’s US Aggregate Index, a broad based unmanaged bond index that is generally considered to be representative of the performance of the investment grade, US dollar-denominated, fixed-rate taxable bond market.
- The ICE BofAML Emerging Markets Sovereign Bond Index is a subset of The BofA Merrill Lynch World Sovereign Bond Index excluding all securities with a country of risk that is a member of the FX G10, all Western European countries, and territories of the U.S. and Western European countries. The FX G10 includes all Euro members, the U.S., Japan, the U.K., Canada, Australia, New Zealand, Switzerland, Norway, and Sweden.
- The Bloomberg Barclays Global Aggregate Index, which measures global investment grade debt from twenty-four local currency markets. This multi-currency benchmark includes treasury, government-related, corporate and securitized fixed-rate bonds from both developed and emerging markets issuers.
- The S&P Global Developed Sovereign Bond index includes local-currency denominated debt publicly issued by governments in their domestic markets.
- S&P Eurozone Developed Sovereign Bond - seeks to measure the performance of Eurozone government bonds.
- The S&P Pan-Europe Developed Sovereign Bond Index is a comprehensive, market-value-weighted index designed to track the performance of local currency-denominated securities publicly issued by Denmark, Norway, Sweden, Switzerland, the U.K. and developed countries in the Eurozone for their domestic markets.
- ICE BofAML Emerging Markets Sovereign Bond - tracks the performance of US dollar (USD) and Euro denominated emerging markets non-sovereign debt publicly issued within the major domestic and Eurobond markets.
- The Bloomberg Barclay’s US Corporate Bond Index (AA), which measures the investment grade, fixed-rate, taxable corporate bond market. It includes USD denominated securities publicly issued by US and non-US industrial, utility and financial issuers.
- The Bloomberg Barclay’s US Corporate High Yield Index, which covers the USD-denominated, non-investment grade, fixed-rate, taxable corporate bond market.
- Bloomberg Barclay’s Global Aggregate Securitized- US Mortgage-Backed Securities, which is a component of the Bloomberg Barclay’s US Aggregate Index and measures investment grade mortgage backed pass-through securities of GNMA, FNMA, and FHLMC.
- Bloomberg Barclay’s Global Aggregate Securitized- US Asset-Backed Securities, which is a component of the Bloomberg Barclay’s US Aggregate Index and includes the pass-throughs, bullets, and controlled amortization structures of only the senior class of ABS issues.
- The Blomberg Barclay’s US Floating Rate Notes (<5 Yr) Index, measures the performance of U.S dollar-dominated, investment grade floating rate notes with maturities less than 5 years.
- The Bloomberg Barclay’s Municipal Bond Index, which measures investment grade, tax-exempt bonds with a maturity of at least one year.
- The S&P/ LSTA Leveraged Loan Index is designed to reflect the performance of the largest facilities in the leveraged loan market.
Key Rates
Key Rates are shown for US Treasurys and London Interbank Offered Rate (LIBOR), the interest rate at which banks offer to lend funds (wholesale money) to one another in the international interbank market. LIBOR is a key benchmark rate that reflects how much it costs banks to borrow from each other. “Current” refers to the percentage rate as of 6/30/2018, while the rates of change are stated in basis points.
Credit Spreads
Credit Spreads shown comprise the Option-Adjusted Spread of the indices indicated, versus the US 10-Year Treasury Yield. “Current” refers to the spread as of 6/30/2018, while the rates of change are stated in basis points.
Key Indicators
Key Indicators correspond to various macro-economic and rate-related data points that we consider impactful to fixed income markets.
- 2s10s (bps)/ 10 Yr vs 2 Yr Treasury Spread, which measures the difference between yields on 10-Year Treasury Constant Maturity Securities and 2-Year Treasury Constant Maturity Securities.
- West Texas Intermediate, which is an oil benchmark and the underlying asset in the New York Mercantile Exchange’s oil futures contract.
- Core Consumer Price Index, which measures the consumer price index excluding food and energy prices. Shown as of the prior month-end.
- Breakeven Inflation: 5 Yr %/ bps, which uses a moving 30-day average of the 5-Year Treasury Constant Maturity Securities and 5-Year Treasury Inflation–Indexed Constant Maturity Securities to derive expected inflation.
- Breakeven Inflation: 10 Yr %/ bps, which uses a moving 30-day average of the 10-Year Treasury Constant Maturity Securities and 10-Year Treasury Inflation–Indexed Constant Maturity Securities to derive expected inflation.
General Disclosure
This document is intended for informational purposes only and should not be otherwise disseminated to other third parties. Past performance or results should not be taken as an indication or guarantee of future performance or results, and no representation or warranty, express or implied is made regarding future performance or results. This document does not constitute an offer to sell, or a solicitation of an offer to purchase, any security, future or other financial instrument or product. This material is proprietary and being provided on a confidential basis, and may not be reproduced, transferred or distributed in any form without prior written permission from WST. WST reserves the right at any time and without notice to change, amend, or cease publication of the information. This material has been prepared solely for informative purposes. The information contained herein includes information that has been obtained from third party sources and has not been independently verified. It is made available on an "as is" basis without warranty and does not represent the performance of any specific investment strategy.
This material is proprietary and being provided on a confidential basis, and may not be reproduced, transferred or distributed in any form without prior written permission from WST. WST reserves the right at any time and without notice to change, amend, or cease publication of the information. This material has been prepared solely for informative purposes. The information contained herein includes information that has been obtained from third party sources and has not been independently verified. It is made available on an "as is" basis without warranty and does not represent the performance of any specific investment .Some of the information enclosed may represent opinions of WST and are subject to change from time to time and do not constitute a recommendation to purchase and sale any security nor to engage in any particular investment strategy. The information contained herein has been obtained from sources believed to be reliable but cannot be guaranteed for accuracy. Past performance is not necessarily indicative of future results. Securities and services are not FDIC or any other government agency insured – Are not bank guaranteed – May lose Value.
Besides attributed information, this material is proprietary and may not be reproduced, transferred or distributed in any form without prior written permission from WST. WST reserves the right at any time and without notice to change, amend, or cease publication of the information. This material has been prepared solely for informative purposes. The information contained herein may include information that has been obtained from third party sources and has not been independently verified. It is made available on an “as is” basis without warranty. This document is intended for clients for informational purposes only and should not be otherwise disseminated to other third parties. Past performance or results should not be taken as an indication or guarantee of future performance or results, and no representation or warranty, express or implied is made regarding future performance or results. This document does not constitute an offer to sell, or a solicitation of an offer to purchase, any security, future or other financial instrument or product.