
1Q 2019 Global Equity Markets Review
With spirits lifted by accommodative tones in everything from central bank pressers to trade discussions, investors put the 4Q meltdown in the rearview and sent global stocks up around 12.3% in the first quarter of 2019. Volatility crumbled during the quarter, with the VIX closing out at half the level reached at the end of 4Q.
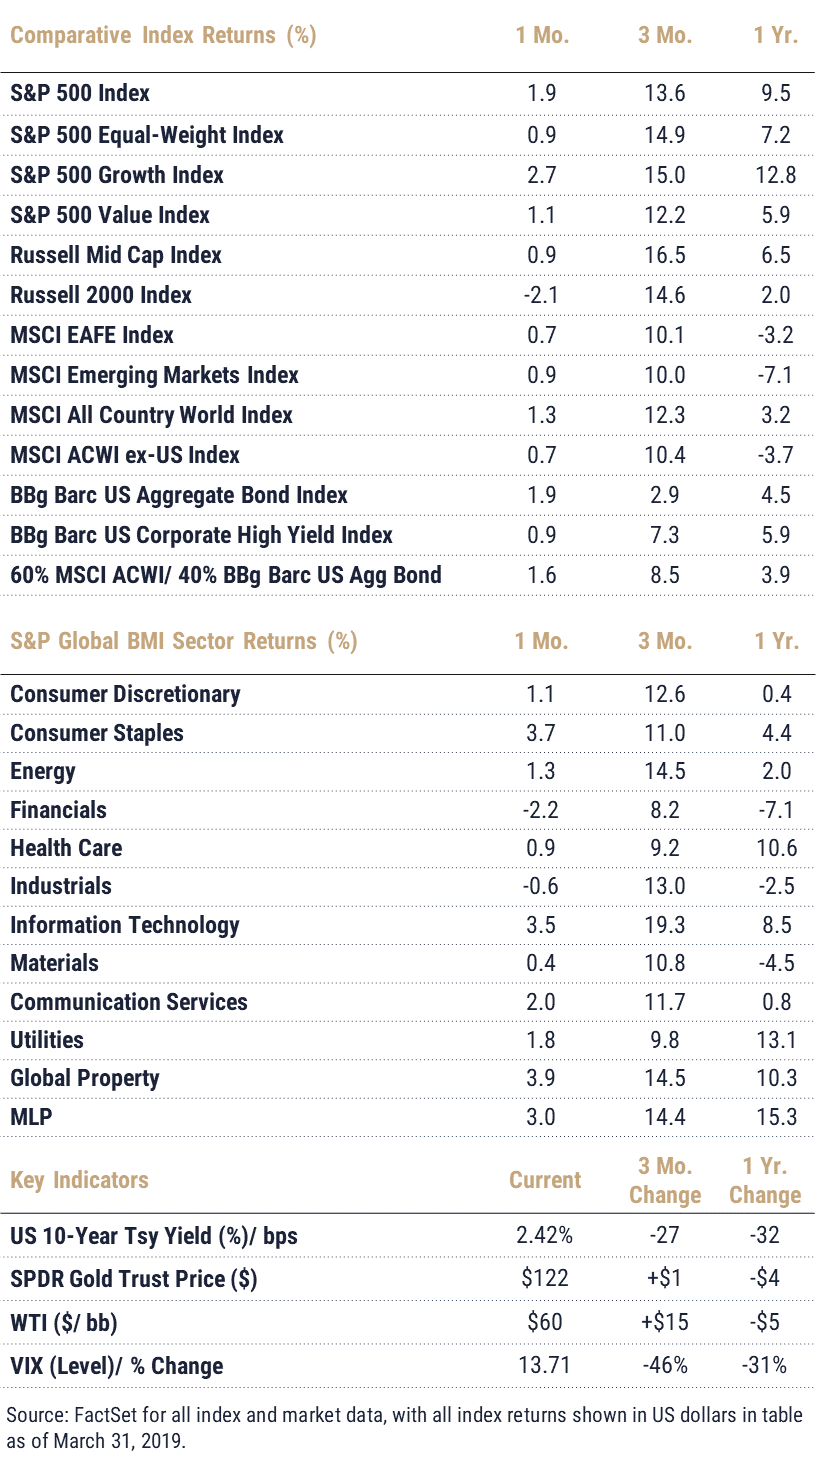
The S&P 500 led broad indices, adding 13.6% (as compared to a loss of 13.5% in the prior quarter) to land the trailing one-year return at 9.5%. Developed ex-US (+10.1%) and emerging markets (+10.0%) eked into double-digits for 1Q, with the ACWI ex-US adding 10.4%; both indices remain in the red for the trailing one-year period.
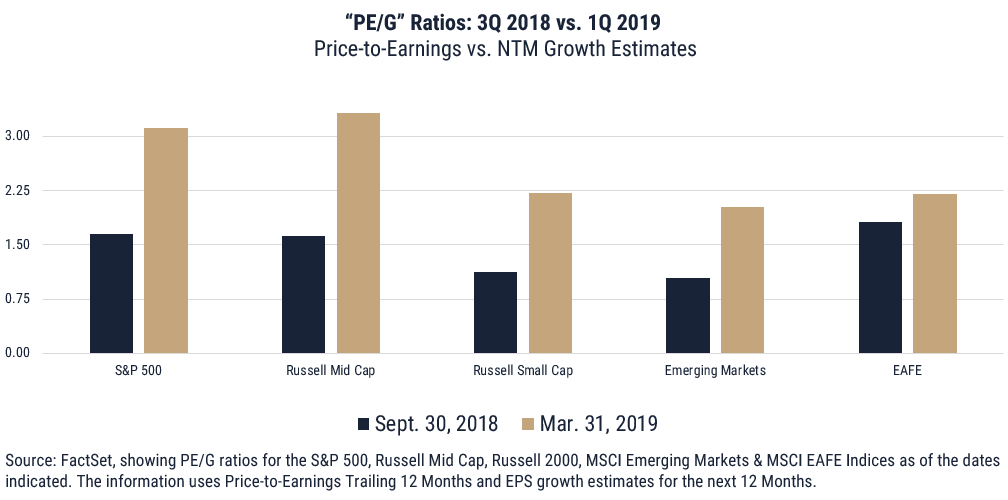
While US heavyweights such as Apple (+21%), Microsoft (+17%), Amazon (+19%), Facebook (+27%), Google (+13%) and Netflix (+33%) came ripping back and drove equity results overall, the rally was broad and deep. US mid-cap stocks (+16.5%) were the overall leaders. Small caps, which ended the quarter up 14.6%, were leading through February-end but retreated in March; short interest rose, with the forward P/E on the index at roughly 21.6x vs. 16.2x for the S&P. As shown in the figure below, with global equity indices at or nearing cyclical or all-time highs, PE/G ratios have expanded as the “G” (growth) moves in the other direction. Further to the capitalization trend, the S&P 500 Equal-Weight Index (+14.9%) outperformed the market-weight S&P. The S&P 500 Value outperformed in January as investors reloaded on US equity risk but the remainder of the quarter saw momentum slow relative to the S&P 500 Growth. Value finished 1Q up 12.2% vs. 15.0% for Growth and lags by 700 basis points on a one-year basis.
4Q’s fire-sale – which in hindsight may feel a bit overdone – of course set the stage for a rebound in price, but underlying the sentiment reversal were legitimate shifts in the most acute pains from 4Q. Outcomes in equity seemed to reflect investor focus on the so-called “Fed Put” and similar global central bank action as well as US-China trade negotiations that – while still not resolved to the positive – yielded enough progress to carry water in the relief rally. US investors found further relief in earnings, which receded in growth terms relative to a record-setting 3Q18 but were up year-over-year and, most importantly, beat estimates that had been drastically reduced. Global sector leadership reflected a mix of factors, with top-performing Technology (+19.3%) announcing the rebound in US giants and Energy (+14.5%) coming in second best as oil prices regrouped from a brutal 4Q.
Facing a cross-current of political messes and collapsing activity (the eurozone manufacturing data marked an outright contraction in February), Europe-driven EAFE participated in the rally but met resistance despite accommodative monetary policy and appealing valuation. Emerging markets’ underperformance may speak more to currency impacts and country-specific hiccups than to the broad macro pressures weighing on developed international markets. Fed dovishness and the implied potential for a softening dollar has shored up appetite for emerging assets over the last several months, but even modest reversal in the currency dynamic underscores the lingering effects of inflation driven by dollar strength in recent history. Nonetheless, Chinese equities added 17.7% during 1Q, supported by constructive trade talks as well as fiscal and monetary stimulus aimed at countering deceleration in manufacturing and housing. India, meanwhile, is poised to surpass China from a GDP perspective and posted a 9% return in March for a gain of 7.2% 1Q. Russia added 12.2% and although Brazil gave back half of its 17.7% January return throughout February and March, it ended the quarter up 8.6%.
Index Returns – all shown in US dollars
All returns shown trailing 3/31/2019 for the period indicated. “YTD” refers to the total return as of prior-year end, while the other returns are annualized. 3-month and annualized returns are shown for:
- The S&P 500 index is comprised of large capitalized companies across many sectors and is generally regarded as representative of US stock market and is provided in this presentation in that regard only.
- The S&P 500® Equal Weight Index (EWI) is the equal-weight version of the widely-used S&P 500. The index includes the same constituents as the capitalization weighted S&P 500, but each company in the S&P 500 EWI is allocated a fixed weight - or 0.2% of the index total at each quarterly rebalance. The S&P 500 equal-weight index (S&P 500 EWI) series imposes equal weights on the index constituents included in the S&P 500 that are classified in the respective GICS® sector.
- The S&P 500 Growth Index is comprised of equities from the S&P 500 that exhibit strong growth characteristics and is weighted by market-capitalization.
- The S&P 500 Value Index is a market-capitalization weighted index comprising of equities from the S&P 500 that exhibit strong value characteristics such as book value to price ratio, cash flow to price ratio, sales to price ratio, and dividend yield.
- The Russell 3000 Index tracks the performance of 3000 U.S. corporations, determined by market-capitalization, and represents 98% of the investable equity market in the United States.
- The Russell Mid Cap Index measures the mid-cap segment performance of the U.S. equity market and is comprised of approximately 800 of the smallest securities based on current index membership and their market capitalization.
- The Russell Micro Cap Index is a market-capitalization weighted index that measures the performance of 2000 small-cap and mid-cap securities. The index was formulated to give investors an unbiased collection of the smallest tradable equities still meeting exchange listing requirements.
- The MSCI All Country World Index provides a measure of performance for the equity market throughout the world and is a free float-adjusted market capitalization weighted index.
- The MSCI EAFE Index is a market-capitalization weighted index and tracks the performance of small to large-cap equities in developed markets of Europe, Australasia, and the Far East.
- The MSCI Emerging Markets Index is a float-adjusted market-capitalization index that measures equity market performance in global emerging markets and cannot be purchased directly by investors.
- The S&P Global BMI sector indices are into sectors as defined by the widely used Global Industry Classification Standards (GICS) classifications. Each sector index comprises those companies included in the S&P Global BMI that are classified as members of respective GICS® sector. The S&P Global BMI Indices were introduced to provide a comprehensive benchmarking system for global equity investors. The S&P Global BMI is comprised of the S&P Emerging BMI and the S&P Developed BMI. It covers approximately 10,000 companies in 46 countries. To be considered for inclusion in the index, all listed stocks within the constituent country must have a float market capitalization of at least $100 million. For a country to be admitted, it must be politically stable and have legal property rights and procedures, among other criteria.
- The Barclay’s US Aggregate Index, a broad based unmanaged bond index that is generally considered to be representative of the performance of the investment grade, US dollar-denominated, fixed-rate taxable bond market.
- The Bloomberg Barclay’s US Corporate High Yield Index, which covers the USD-denominated, non-investment grade, fixed-rate, taxable corporate bond market.
Key Indicators
Key Indicators correspond to various macro-economic and rate-related data points that we consider impactful to equity markets.
- The US 10-Year Treasury Yield (%)/bps, is the return on investment for the U.S. government’s 10-year debt obligation and serves as a signal for investor confidence.
- SPDR Gold Trust Price ($), is an investment fund that reflects the performance on the price of a gold bullion, less the Trust’s expenses.
- West Texas Intermediate, which is an oil benchmark and the underlying asset in the New York Mercantile Exchange’s oil futures contract.
- CBOE Volatility Index (Level)/% Change, which uses price options on the S&P 500 to estimate the market's expectation of 30-day volatility.
General Disclosure
This document is intended for informational purposes only and should not be otherwise disseminated to other third parties. Past performance or results should not be taken as an indication or guarantee of future performance or results, and no representation or warranty, express or implied is made regarding future performance or results. This document does not constitute an offer to sell, or a solicitation of an offer to purchase, any security, future or other financial instrument or product. This material is proprietary and being provided on a confidential basis, and may not be reproduced, transferred or distributed in any form without prior written permission from WST. WST reserves the right at any time and without notice to change, amend, or cease publication of the information. This material has been prepared solely for informative purposes. The information contained herein includes information that has been obtained from third party sources and has not been independently verified. It is made available on an "as is" basis without warranty and does not represent the performance of any specific investment strategy.
This commentary also includes performance figures for the SPDR Gold Trust (GLD), which is used as a proxy for the performance of the asset class, given the security’s prominence as a means of accessing exposure to the asset class. We believe use of this proxy is appropriate in the context of providing our clients and Advisors with relevant information about markets. We consider an index to be a portfolio of securities whose composition and proportions are derived from a rules-based model. See the appropriate disclosures regarding models, indices and the related performance. You cannot invest directly in an index and the performance of an index does not represent the performance of any specific investment. Some of the information enclosed may represent opinions of WST and are subject to change from time to time and do not constitute a recommendation to purchase and sale any security nor to engage in any particular investment strategy.
Past performance or results should not be taken as an indication or guarantee of future performance or results, and no representation or warranty, express or implied is made regarding future performance or results. This document does not constitute an offer to sell, or a solicitation of an offer to purchase, any security, future or other financial instrument or product. This material is proprietary and being provided on a confidential basis, and may not be reproduced, transferred or distributed in any form without prior written permission from WST. WST reserves the right at any time and without notice to change, amend, or cease publication of the information. This material has been prepared solely for informative purposes. The information contained herein includes information that has been obtained from third party sources and has not been independently verified. It is made available on an "as is" basis without warranty and does not represent the performance of any specific investment .Some of the information enclosed may represent opinions of WST and are subject to change from time to time and do not constitute a recommendation to purchase and sale any security nor to engage in any particular investment strategy. The information contained herein has been obtained from sources believed to be reliable but cannot be guaranteed for accuracy. Past performance is not necessarily indicative of future results. Securities and services are not FDIC or any other government agency insured – Are not bank guaranteed – May lose Value.
Besides attributed information, this material is proprietary and may not be reproduced, transferred or distributed in any form without prior written permission from WST. WST reserves the right at any time and without notice to change, amend, or cease publication of the information. This material has been prepared solely for informative purposes. The information contained herein may include information that has been obtained from third party sources and has not been independently verified. It is made available on an “as is” basis without warranty. This document is intended for clients for informational purposes only and should not be otherwise disseminated to other third parties. Past performance or results should not be taken as an indication or guarantee of future performance or results, and no representation or warranty, express or implied is made regarding future performance or results. This document does not constitute an offer to sell, or a solicitation of an offer to purchase, any security, future or other financial instrument or product.