
February 2019 Global Equity Markets Review
Equity investors weren’t in quite the same hurry as they were in January, but February saw solid returns across geographies, styles and sectors. Global stocks as measured by the MSCI All Country World Index added 2.7%, bringing the year-to-date figure to 10.9% and the trailing one-year number just shy of positive. Up 3.2% for the S&P 500, the US stole back the show as emerging markets (+0.2%) took a breather, lagging the MSCI EAFE (+2.6%) and bringing up the rear in ex-US equity overall.
Especially in the US, outcomes in equity seemed to reflect investor focus on the so-called “Fed Put” as well as trade negotiations that yielded enough progress to delay the planned month-end tariff hike. Investors found further relief in earnings, which receded in growth terms relative to a record-setting 3Q18 but were up year-over-year and most importantly, beat estimates that had been drastically reduced. Big outperformers on a US sector basis included Technology (+6.9%), Industrials (+6.4%) and Materials (+3.3%). Albeit less emphatically than in January, the S&P 500 Equal-Weight Index outperformed the market-weight index, in keeping with an exuberant change in sentiment towards the back half of the capitalization spectrum. US small caps, as measured by the Russell 2000 Index, posted a market-leading return of 5.2%. Reversing position relative to January, the S&P 500 Growth outperformed the S&P 500 Value, consistent with an interesting and relatively recent trend in that index – i.e., value leading in big rally months and growth performing better when gains are more modest or markets are negative. Consistent with the prior month, Russell indices down the cap spectrum saw growth post best results. Growth appetite is most pronounced in mid cap, where the growth index tops value by roughly 425 basis points on a year-to-date basis alone.
Global sectors rose, largely mirroring US sector leadership and buoyed by the same factors – more civil political and trade talks plus accommodative signs from central banks.
Only Global Property, which had led markets alongside Energy in January, slumped as global growth headlines seemed to catch up with the sector and Chinese home-buying (both in and outside the country) slowed markedly, making headlines. Energy (+2.2%) rose with oil prices, continuing to regroup from a brutal 4Q.
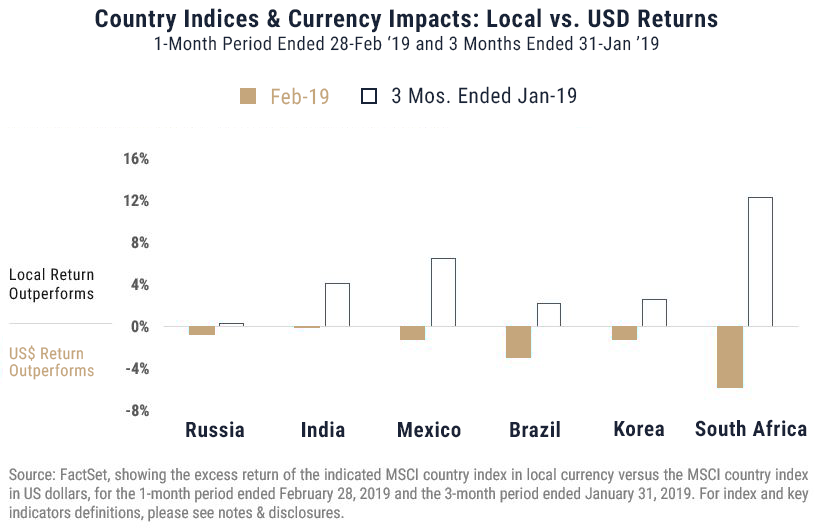
Chinese equities continue to recover and are up around 15% year to date, bolstered by reasonably constructive trade discussions as well as a mix of fiscal and monetary stimulus aimed at countering deceleration seen in manufacturing and housing data. But with respect to other key emerging economies, as shown in the chart below currency movements took some wind out of the sails during February. Fed dovishness and the implied potential for a softening dollar has shored up appetite for emerging assets over the last several months, but currency impacts reversed during February for a handful of key emerging economies, undermining this key theme and underscoring the lingering effects of inflation driven by dollar strength over the last year.
As with the prior month, the MSCI EAFE (+2.6%) posted a competitive return but year-to-date it just barely outperforms emerging markets despite lacking the strong-dollar excuse to the same degree. In light of political strife and collapsing activity (the eurozone manufacturing data marked an outright contraction in February) and despite a highly accommodative posture by the ECB, sentiment in Europe remains so poor that investors appear to be resisting the would-be valuation bait.
For more market updates, visit the WST blog.
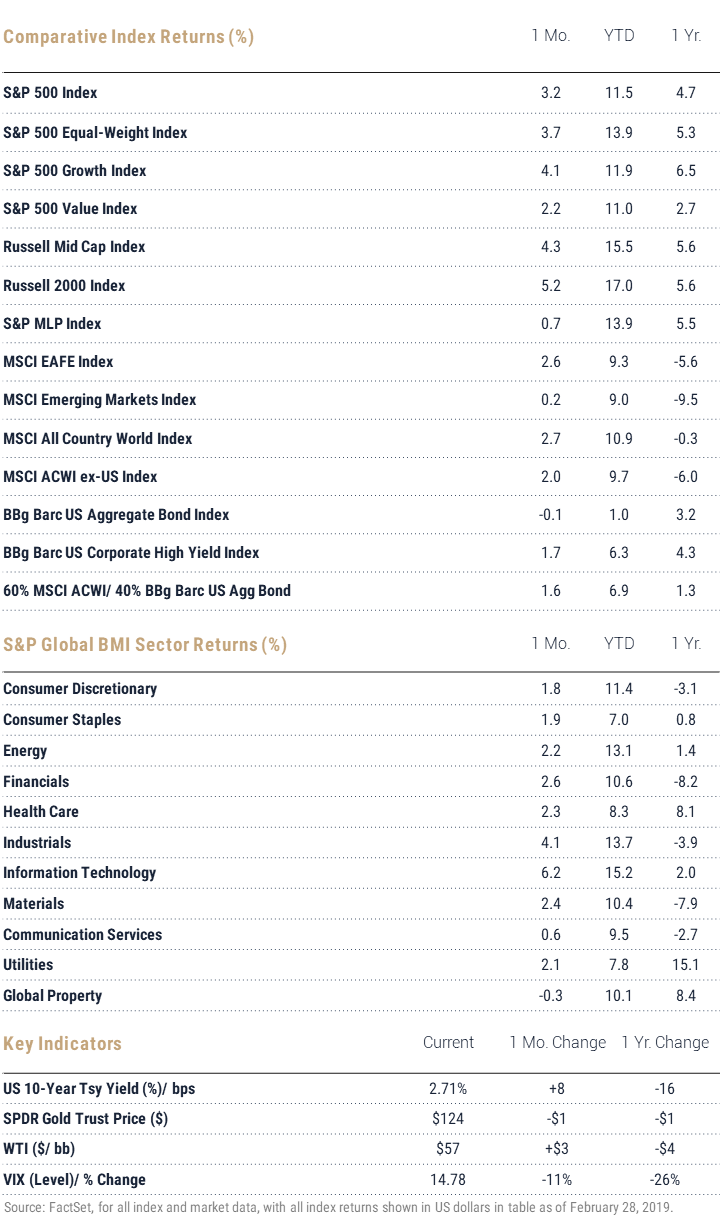
Index Returns – all shown in US dollars
All returns shown trailing 2/28/2019 for the period indicated. “YTD” refers to the total return as of prior-year end, while the other returns are annualized. 3-month and annualized returns are shown for:
- The S&P 500 index is comprised of large capitalized companies across many sectors and is generally regarded as representative of US stock market and is provided in this presentation in that regard only.
- The S&P 500® Equal Weight Index (EWI) is the equal-weight version of the widely-used S&P 500. The index includes the same constituents as the capitalization weighted S&P 500, but each company in the S&P 500 EWI is allocated a fixed weight - or 0.2% of the index total at each quarterly rebalance. The S&P 500 equal-weight index (S&P 500 EWI) series imposes equal weights on the index constituents included in the S&P 500 that are classified in the respective GICS® sector.
- The S&P 500 Growth Index is comprised of equities from the S&P 500 that exhibit strong growth characteristics and is weighted by market-capitalization.
- The S&P 500 Value Index is a market-capitalization weighted index comprising of equities from the S&P 500 that exhibit strong value characteristics such as book value to price ratio, cash flow to price ratio, sales to price ratio, and dividend yield.
- The Russell 3000 Index tracks the performance of 3000 U.S. corporations, determined by market-capitalization, and represents 98% of the investable equity market in the United States.
- The Russell Mid Cap Index measures the mid-cap segment performance of the U.S. equity market and is comprised of approximately 800 of the smallest securities based on current index membership and their market capitalization.
- The Russell Micro Cap Index is a market-capitalization weighted index that measures the performance of 2000 small-cap and mid-cap securities. The index was formulated to give investors an unbiased collection of the smallest tradable equities still meeting exchange listing requirements.
- The MSCI All Country World Index provides a measure of performance for the equity market throughout the world and is a free float-adjusted market capitalization weighted index.
- The MSCI EAFE Index is a market-capitalization weighted index and tracks the performance of small to large-cap equities in developed markets of Europe, Australasia, and the Far East.
- The MSCI Emerging Markets Index is a float-adjusted market-capitalization index that measures equity market performance in global emerging markets and cannot be purchased directly by investors.
- The S&P Global BMI sector indices are into sectors as defined by the widely used Global Industry Classification Standards (GICS) classifications. Each sector index comprises those companies included in the S&P Global BMI that are classified as members of respective GICS® sector. The S&P Global BMI Indices were introduced to provide a comprehensive benchmarking system for global equity investors. The S&P Global BMI is comprised of the S&P Emerging BMI and the S&P Developed BMI. It covers approximately 10,000 companies in 46 countries. To be considered for inclusion in the index, all listed stocks within the constituent country must have a float market capitalization of at least $100 million. For a country to be admitted, it must be politically stable and have legal property rights and procedures, among other criteria.
- The Barclay’s US Aggregate Index, a broad based unmanaged bond index that is generally considered to be representative of the performance of the investment grade, US dollar-denominated, fixed-rate taxable bond market.
- The Bloomberg Barclay’s US Corporate High Yield Index, which covers the USD-denominated, non-investment grade, fixed-rate, taxable corporate bond market.
Key Indicators
Key Indicators correspond to various macro-economic and rate-related data points that we consider impactful to equity markets.
- The US 10-Year Treasury Yield (%)/bps, is the return on investment for the U.S. government’s 10-year debt obligation and serves as a signal for investor confidence.
- SPDR Gold Trust Price ($), is an investment fund that reflects the performance on the price of a gold bullion, less the Trust’s expenses.
- West Texas Intermediate, which is an oil benchmark and the underlying asset in the New York Mercantile Exchange’s oil futures contract.
- CBOE Volatility Index (Level)/% Change, which uses price options on the S&P 500 to estimate the market's expectation of 30-day volatility.
General Disclosure
This document is intended for informational purposes only and should not be otherwise disseminated to other third parties. Past performance or results should not be taken as an indication or guarantee of future performance or results, and no representation or warranty, express or implied is made regarding future performance or results. This document does not constitute an offer to sell, or a solicitation of an offer to purchase, any security, future or other financial instrument or product. This material is proprietary and being provided on a confidential basis, and may not be reproduced, transferred or distributed in any form without prior written permission from WST. WST reserves the right at any time and without notice to change, amend, or cease publication of the information. This material has been prepared solely for informative purposes. The information contained herein includes information that has been obtained from third party sources and has not been independently verified. It is made available on an "as is" basis without warranty and does not represent the performance of any specific investment strategy.
This commentary also includes performance figures for the SPDR Gold Trust (GLD), which is used as a proxy for the performance of the asset class, given the security’s prominence as a means of accessing exposure to the asset class. We believe use of this proxy is appropriate in the context of providing our clients and Advisors with relevant information about markets. We consider an index to be a portfolio of securities whose composition and proportions are derived from a rules-based model. See the appropriate disclosures regarding models, indices and the related performance. You cannot invest directly in an index and the performance of an index does not represent the performance of any specific investment. Some of the information enclosed may represent opinions of WST and are subject to change from time to time and do not constitute a recommendation to purchase and sale any security nor to engage in any particular investment strategy.
Past performance or results should not be taken as an indication or guarantee of future performance or results, and no representation or warranty, express or implied is made regarding future performance or results. This document does not constitute an offer to sell, or a solicitation of an offer to purchase, any security, future or other financial instrument or product. This material is proprietary and being provided on a confidential basis, and may not be reproduced, transferred or distributed in any form without prior written permission from WST. WST reserves the right at any time and without notice to change, amend, or cease publication of the information. This material has been prepared solely for informative purposes. The information contained herein includes information that has been obtained from third party sources and has not been independently verified. It is made available on an "as is" basis without warranty and does not represent the performance of any specific investment .Some of the information enclosed may represent opinions of WST and are subject to change from time to time and do not constitute a recommendation to purchase and sale any security nor to engage in any particular investment strategy. The information contained herein has been obtained from sources believed to be reliable but cannot be guaranteed for accuracy. Past performance is not necessarily indicative of future results. Securities and services are not FDIC or any other government agency insured – Are not bank guaranteed – May lose Value.
Besides attributed information, this material is proprietary and may not be reproduced, transferred or distributed in any form without prior written permission from WST. WST reserves the right at any time and without notice to change, amend, or cease publication of the information. This material has been prepared solely for informative purposes. The information contained herein may include information that has been obtained from third party sources and has not been independently verified. It is made available on an “as is” basis without warranty. This document is intended for clients for informational purposes only and should not be otherwise disseminated to other third parties. Past performance or results should not be taken as an indication or guarantee of future performance or results, and no representation or warranty, express or implied is made regarding future performance or results. This document does not constitute an offer to sell, or a solicitation of an offer to purchase, any security, future or other financial instrument or product.