
August 2022 | Global Equity Markets Review
The stock market carried positive momentum from July into mid-August, when rising interest rates prompted by strong words from the Federal Reserve caused a reversal in equity prices. The S&P 500 fell 4.08% (total return) in August, while the S&P 400 Mid Cap and S&P 600 Small Cap dropped 3.10% and 4.39%, respectively. The late August decline ended the rally prompted by Fed Chairman Jay Powell’s mid-July press conference, the tone of which gave investors hope the Fed could slow the pace of its rate hikes. The S&P 500 was up 4.23% as of the August 16th close before falling in the following eight of the eleven trading days to close the month solidly in the red. Economic weakness was widespread with both cyclical and non-cyclical sectors declining. After a strong showing in an up market the previous month, growth stocks underperformed value stocks in August — a typical pattern in a down market accompanied by rising interest rates.
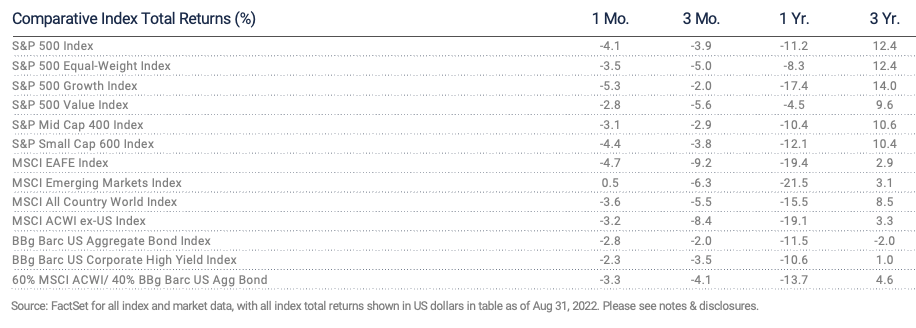
Stubborn inflation and the Fed’s response to it remain the central concerns for investors. Both stocks and bonds rallied in the days following the August 10th release of the Consumer Price Index for July, which showed inflation had “slowed” from 9.1% year over year in June to 8.5% in July. Hopes for a less hawkish Fed were quickly dashed as several voting members of the Federal Open Market Committee reaffirmed their commitment to the inflation fight despite the latest data. Stocks and bonds turned lower simultaneously with declines in six of the 11 remaining trading days in August — an unusual pattern as bonds usually rally in price when stocks decline as investors seek the relative safety of fixed income. Both equity and fixed income markets will need to see substantial progress on inflation validated by the Federal Reserve before they can move higher on a sustainable path.
International equity markets, particularly emerging markets, held up a bit better than the U.S. indices in August. The S&P Global ex U.S. total return was -3.98%, with developed market ex U.S. falling 4.39% and the Emerging Market Index rising 1.46%. Weakness in developed markets was most noticeable in Europe as high inflation was compounded by the war in Ukraine. Emerging market strength was found in both Asia-Pacific and Latin American bourses.
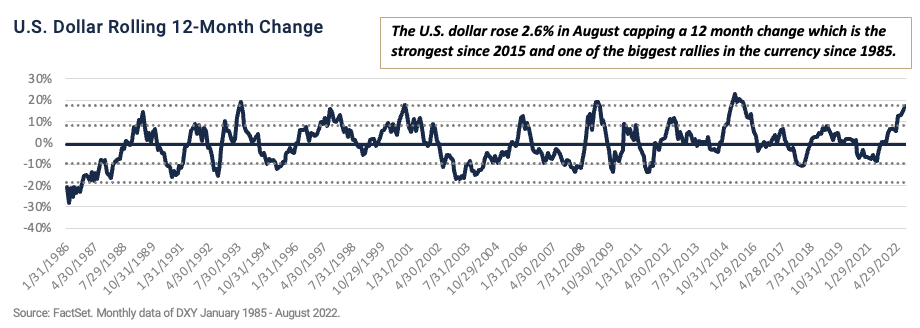
The U.S. dollar rose again in August. As the graph above illustrates the dollar is enjoying its strongest year since 2015 and one of the most impressive stretches of relative strength in over thirty years. Patriotic pride in the strength of our currency notwithstanding, a strongly appreciating dollar has some negative consequences. Most of the commodities traded worldwide are priced in dollars and most large U.S. companies have substantial international business. A rapidly rising dollar creates a headwind for global economic growth and dampens the profits of U.S. companies with significant foreign sales.
All eyes remained on the Federal Reserve in mid-August as investors pondered the potential consequences of an economic recession driven by a central bank determined to bring down inflation that remains at the highest level in decades. Clearly, the risk of recession rose in August as the tone of central bank rhetoric around the world became more hawkish. Normal lead times of the impact changes in monetary and fiscal policies have on the economy are of little value as we face the ongoing impact of the global pandemic and the uncertainties associated with the war in Ukraine complicate the economic outlook and expand an already broad range of outcomes. Market volatility is understandably high in this environment, making disciplined asset allocation and a long-term perspective all the more important.
Notes & Disclosures
Index Returns – all shown in US dollars
All returns shown trailing 8/31/2022 for the period indicated. “YTD” refers to the total return as of prior-year end, while the other returns are annualized. 3-month and annualized returns are shown for:
- The S&P 500 index is comprised of large capitalized companies across many sectors and is generally regarded as representative of US stock market and is provided in this presentation in that regard only.
- The S&P 500® Equal Weight Index (EWI) is the equal-weight version of the widely-used S&P 500. The index includes the same constituents as the capitalization weighted S&P 500, but each company in the S&P 500 EWI is allocated a fixed weight - or 0.2% of the index total at each quarterly rebalance. The S&P 500 equal-weight index (S&P 500 EWI) series imposes equal weights on the index constituents included in the S&P 500 that are classified in the respective GICS® sector.
- The S&P 500 Growth Index is comprised of equities from the S&P 500 that exhibit strong growth characteristics and is weighted by market-capitalization.
- The S&P 500 Value Index is a market-capitalization weighted index comprising of equities from the S&P 500 that exhibit strong value characteristics such as book value to price ratio, cash flow to price ratio, sales to price ratio, and dividend yield.
- The Russell 3000 Index tracks the performance of 3000 U.S. corporations, determined by market-capitalization, and represents 98% of the investable equity market in the United States.
- The Russell Mid Cap Index measures the mid-cap segment performance of the U.S. equity market and is comprised of approximately 800 of the smallest securities based on current index membership and their market capitalization.
- The Russell 2000 Index is a market-capitalization weighted index that measures the performance of 2000 small-cap and mid-cap securities. The index was formulated to give investors an unbiased collection of the smallest tradable equities still meeting exchange listing requirements.
- The MSCI All Country World Index provides a measure of performance for the equity market throughout the world and is a free float-adjusted market capitalization weighted index.
- The MSCI EAFE Index is a market-capitalization weighted index and tracks the performance of small to large-cap equities in developed markets of Europe, Australasia, and the Far East.
- The MSCI Emerging Markets Index is a float-adjusted market-capitalization index that measures equity market performance in global emerging markets and cannot be purchased directly by investors.
- The S&P Global BMI sector indices are into sectors as defined by the widely used Global Industry Classification Standards (GICS) classifications. Each sector index comprises those companies included in the S&P Global BMI that are classified as members of respective GICS® sector. The S&P Global BMI Indices were introduced to provide a comprehensive benchmarking system for global equity investors. The S&P Global BMI is comprised of the S&P Emerging BMI and the S&P Developed BMI. It covers approximately 10,000 companies in 46 countries. To be considered for inclusion in the index, all listed stocks within the constituent country must have a float market capitalization of at least $100 million. For a country to be admitted, it must be politically stable and have legal property rights and procedures, among other criteria.
- The Barclay’s US Aggregate Index, a broad-based unmanaged bond index that is generally considered to be representative of the performance of the investment grade, US dollar-denominated, fixed-rate taxable bond market.
- The Bloomberg Barclay’s US Corporate High Yield Index, which covers the USD-denominated, non-investment grade, fixed-rate, taxable corporate bond market.
An index is a portfolio of specific securities, the performance of which is often used as a benchmark in judging the relative performance to certain asset classes. Index performance used throughout is intended to illustrate historical market trends and performance. Indexes are managed and do not incur investment management fees. An investor is unable to invest in an index. Their performance does not reflect the expenses associated with the management of an actual portfolio. No strategy assures success or protects against loss. There is no guarantee that a diversified portfolio will enhance overall returns or outperform a non-diversified portfolio. Diversification does not protect against market risk. All investing involves risk including loss of principal. Investing in stock includes numerous specific risks including: the fluctuation of dividend, loss of principal, and potential liquidity of the investment in a falling market. Past performance is no guarantee of future results.
Key Indicators
Key Indicators correspond to various macro-economic and rate-related data points that we consider impactful to equity markets.
- The US 10-Year Treasury Yield (%)/bps, is the return on investment for the U.S. government’s 10-year debt obligation and serves as a signal for investor confidence.
- SPDR Gold Trust Price ($), is an investment fund that reflects the performance on the price of a gold bullion, less the Trust’s expenses.
- West Texas Intermediate, which is an oil benchmark and the underlying asset in the New York Mercantile Exchange’s oil futures contract.
- CBOE Volatility Index (Level)/% Change, which uses price options on the S&P 500 to estimate the market's expectation of 30-day volatility.
General Disclosure
Wilbanks, Smith & Thomas Asset Management (WST) is an investment adviser registered under the Investment Advisers Act of 1940. Registration as an investment adviser does not imply any level of skill or training. The information presented in the material is general in nature and is not designed to address your investment objectives, financial situation or particular needs. Prior to making any investment decision, you should assess, or seek advice from a professional regarding whether any particular transaction is relevant or appropriate to your individual circumstances. This material is not intended to replace the advice of a qualified tax advisor, attorney, or accountant. Consultation with the appropriate professional should be done before any financial commitments regarding the issues related to the situation are made.
This document is intended for informational purposes only and should not be otherwise disseminated to other third parties. Past performance or results should not be taken as an indication or guarantee of future performance or results, and no representation or warranty, express or implied is made regarding future performance or results. This document does not constitute an offer to sell, or a solicitation of an offer to purchase, any security, future or other financial instrument or product. This material is proprietary and being provided on a confidential basis, and may not be reproduced, transferred or distributed in any form without prior written permission from WST. WST reserves the right at any time and without notice to change, amend, or cease publication of the information. The information contained herein includes information that has been obtained from third party sources and has not been independently verified. It is made available on an "as is" basis without warranty and does not represent the performance of any specific investment strategy.
Some of the information enclosed may represent opinions of WST and are subject to change from time to time and do not constitute a recommendation to purchase and sale any security nor to engage in any particular investment strategy. The information contained herein has been obtained from sources believed to be reliable but cannot be guaranteed for accuracy.
Besides attributed information, this material is proprietary and may not be reproduced, transferred or distributed in any form without prior written permission from WST. WST reserves the right at any time and without notice to change, amend, or cease publication of the information. This material has been prepared solely for informative purposes. The information contained herein may include information that has been obtained from third party sources and has not been independently verified. It is made available on an “as is” basis without warranty. This document is intended for clients for informational purposes only and should not be otherwise disseminated to other third parties. Past performance or results should not be taken as an indication or guarantee of future performance or results, and no representation or warranty, express or implied is made regarding future performance or results. This document does not constitute an offer to sell, or a solicitation of an offer to purchase, any security, future or other financial instrument or product.