
April 2022 | Global Equity Markets Overview
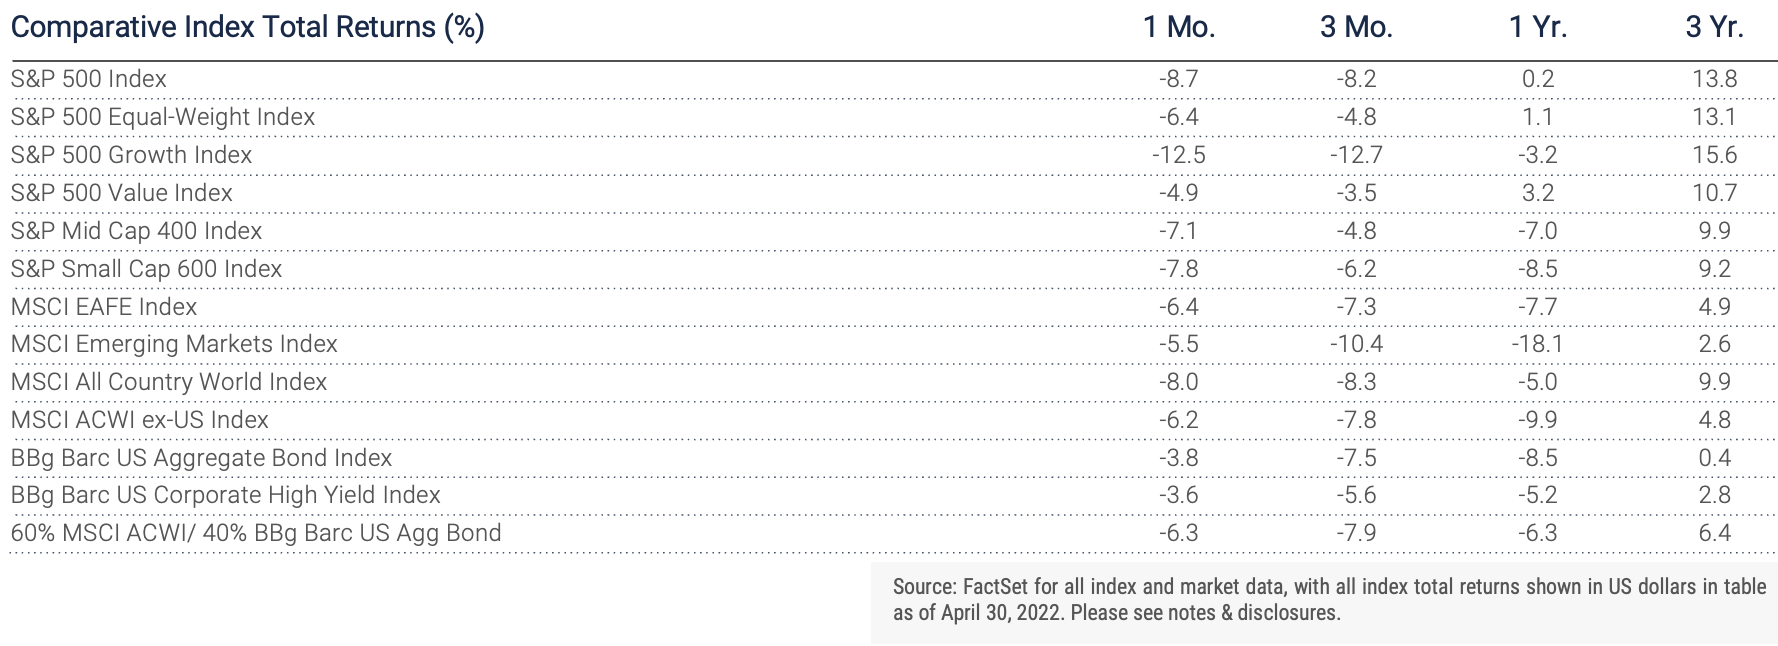
Equity markets resumed the downward trend briefly interrupted by a mid-month rally in March. Consternation over inflation, trepidation over a policy mistake by the Federal Reserve and resignation of an extended conflict in Ukraine all combined to produce an unusually weak April. The S&P 500 Index price return of -8.8% was the lowest return since April 1970 and the 4th worst return since 1928. The decline was even more unusual considering April has historically been the second strongest calendar month of the year, surpassed only by December. Strong valuation support and lower exposure in key sectors limited the losses in the S&P 400 Mid Cap and S&P 600 Small Cap Indexes to -7.1 and -7.8%, respectively. Communication Services and Consumer Discretionary sectors are dominated by the largest companies in the market and many of them underperformed during April. The value style reasserted its outperformance over growth in April after a mixed March. April marks the 6th consecutive month of value leadership when the broad market declined by at least 2%.
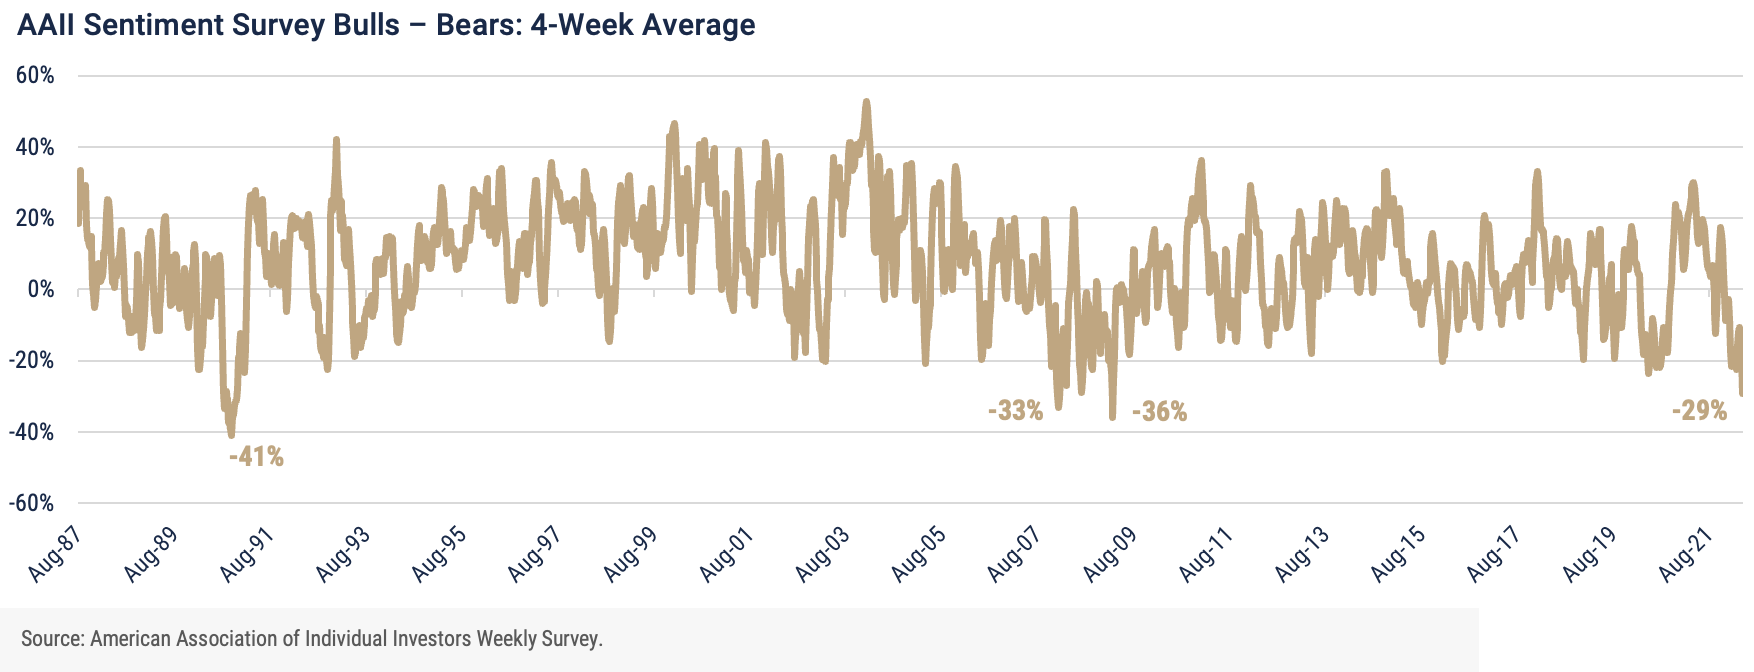
One of the more widely followed investment sentiment indicators is a weekly survey conducted by the American Association of Individual Investors. It has been conducted since mid-1987 asking members whether they are bullish, neutral or bearish on the stock market over the following six months. The chart below illustrates the percentage of respondents who answered bullish minus those who considered themselves as bearish. The volatility of this survey is easily observable and not of much value for gleaning long-term trends. However, it is notable the current 4-week average survey is among the most pessimistic it’s been over the 25-year history. There is much academic research documenting extremes in investor expectations, pointing to inflection points in the market. The current level suggests the negative data moving stocks lower are being quickly discounted by investors and lowers the bar for unexpected good news from the factors listed above to move stocks higher. Valuation risk has also moved lower with the forward P/E ratio now below the trailing 5-year median for the first time since the onset of the pandemic. This is further confirmation investor expectations have quickly reset to much lower levels which will mitigate the risk of a more punishing decline in stock prices from news already known.
Global equity bourses reversed the unfavorable comparison to the U.S. equity market in March with better performance in a down market. The S&P Global ex-U.S. index total return in April was -6.7% compared to -8.7% in the broad S&P 1500 Composite Index. Developed ex-U.S. markets were down 6.7% while emerging markets performed relatively well with a negative total return of -5.4%. Strength in major country weights in the global index was notable in the U.K., Switzerland, and France while weakness was notable in China, Japan and Germany. The weakest region was in Latin America which has been performing exceptionally well leading into April.
Performance in overseas markets in April during a down market was made even more remarkable by a strong month for the U.S. dollar. The value of the dollar in foreign currency markets increased 4.7% in April, the strongest move in over seven years and the 19th biggest month advance since 1985 (447 months). The primary reason for the increase centers on the Federal Reserve which has telegraphed raising rates faster than other central banks, in particular the Bank of Japan and the European Central Bank, where there has been measurable weakness in the Yen and the Euro. Dollar momentum has historically been fleeting and the heat of the dollar’s recent rise may cool as other central banks deal with the same problem of inflation and unwinding the unprecedented monetary stimulus during the global pandemic.
Notes & Disclosures
Index Returns – all shown in US dollars
All returns shown trailing 4/30/2022 for the period indicated. “YTD” refers to the total return as of prior-year end, while the other returns are annualized. 3-month and annualized returns are shown for:
- The S&P 500 index is comprised of large capitalized companies across many sectors and is generally regarded as representative of US stock market and is provided in this presentation in that regard only.
- The S&P 500® Equal Weight Index (EWI) is the equal-weight version of the widely-used S&P 500. The index includes the same constituents as the capitalization weighted S&P 500, but each company in the S&P 500 EWI is allocated a fixed weight - or 0.2% of the index total at each quarterly rebalance. The S&P 500 equal-weight index (S&P 500 EWI) series imposes equal weights on the index constituents included in the S&P 500 that are classified in the respective GICS® sector.
- The S&P 500 Growth Index is comprised of equities from the S&P 500 that exhibit strong growth characteristics and is weighted by market-capitalization.
- The S&P 500 Value Index is a market-capitalization weighted index comprising of equities from the S&P 500 that exhibit strong value characteristics such as book value to price ratio, cash flow to price ratio, sales to price ratio, and dividend yield.
- The Russell 3000 Index tracks the performance of 3000 U.S. corporations, determined by market-capitalization, and represents 98% of the investable equity market in the United States.
- The Russell Mid Cap Index measures the mid-cap segment performance of the U.S. equity market and is comprised of approximately 800 of the smallest securities based on current index membership and their market capitalization.
- The Russell 2000 Index is a market-capitalization weighted index that measures the performance of 2000 small-cap and mid-cap securities. The index was formulated to give investors an unbiased collection of the smallest tradable equities still meeting exchange listing requirements.
- The MSCI All Country World Index provides a measure of performance for the equity market throughout the world and is a free float-adjusted market capitalization weighted index.
- The MSCI EAFE Index is a market-capitalization weighted index and tracks the performance of small to large-cap equities in developed markets of Europe, Australasia, and the Far East.
- The MSCI Emerging Markets Index is a float-adjusted market-capitalization index that measures equity market performance in global emerging markets and cannot be purchased directly by investors.
- The S&P Global BMI sector indices are into sectors as defined by the widely used Global Industry Classification Standards (GICS) classifications. Each sector index comprises those companies included in the S&P Global BMI that are classified as members of respective GICS® sector. The S&P Global BMI Indices were introduced to provide a comprehensive benchmarking system for global equity investors. The S&P Global BMI is comprised of the S&P Emerging BMI and the S&P Developed BMI. It covers approximately 10,000 companies in 46 countries. To be considered for inclusion in the index, all listed stocks within the constituent country must have a float market capitalization of at least $100 million. For a country to be admitted, it must be politically stable and have legal property rights and procedures, among other criteria.
- The Barclay’s US Aggregate Index, a broad-based unmanaged bond index that is generally considered to be representative of the performance of the investment grade, US dollar-denominated, fixed-rate taxable bond market.
- The Bloomberg Barclay’s US Corporate High Yield Index, which covers the USD-denominated, non-investment grade, fixed-rate, taxable corporate bond market.
An index is a portfolio of specific securities, the performance of which is often used as a benchmark in judging the relative performance to certain asset classes. Index performance used throughout is intended to illustrate historical market trends and performance. Indexes are managed and do not incur investment management fees. An investor is unable to invest in an index. Their performance does not reflect the expenses associated with the management of an actual portfolio. No strategy assures success or protects against loss. There is no guarantee that a diversified portfolio will enhance overall returns or outperform a non-diversified portfolio. Diversification does not protect against market risk. All investing involves risk including loss of principal. Investing in stock includes numerous specific risks including: the fluctuation of dividend, loss of principal, and potential liquidity of the investment in a falling market. Past performance is no guarantee of future results.
Key Indicators
Key Indicators correspond to various macro-economic and rate-related data points that we consider impactful to equity markets.
- The US 10-Year Treasury Yield (%)/bps, is the return on investment for the U.S. government’s 10-year debt obligation and serves as a signal for investor confidence.
- SPDR Gold Trust Price ($), is an investment fund that reflects the performance on the price of a gold bullion, less the Trust’s expenses.
- West Texas Intermediate, which is an oil benchmark and the underlying asset in the New York Mercantile Exchange’s oil futures contract.
- CBOE Volatility Index (Level)/% Change, which uses price options on the S&P 500 to estimate the market's expectation of 30-day volatility.
General Disclosure
Wilbanks, Smith & Thomas Asset Management (WST) is an investment adviser registered under the Investment Advisers Act of 1940. Registration as an investment adviser does not imply any level of skill or training. The information presented in the material is general in nature and is not designed to address your investment objectives, financial situation or particular needs. Prior to making any investment decision, you should assess, or seek advice from a professional regarding whether any particular transaction is relevant or appropriate to your individual circumstances. This material is not intended to replace the advice of a qualified tax advisor, attorney, or accountant. Consultation with the appropriate professional should be done before any financial commitments regarding the issues related to the situation are made.
This document is intended for informational purposes only and should not be otherwise disseminated to other third parties. Past performance or results should not be taken as an indication or guarantee of future performance or results, and no representation or warranty, express or implied is made regarding future performance or results. This document does not constitute an offer to sell, or a solicitation of an offer to purchase, any security, future or other financial instrument or product. This material is proprietary and being provided on a confidential basis, and may not be reproduced, transferred or distributed in any form without prior written permission from WST. WST reserves the right at any time and without notice to change, amend, or cease publication of the information. The information contained herein includes information that has been obtained from third party sources and has not been independently verified. It is made available on an "as is" basis without warranty and does not represent the performance of any specific investment strategy.
Some of the information enclosed may represent opinions of WST and are subject to change from time to time and do not constitute a recommendation to purchase and sale any security nor to engage in any particular investment strategy. The information contained herein has been obtained from sources believed to be reliable but cannot be guaranteed for accuracy.
Besides attributed information, this material is proprietary and may not be reproduced, transferred or distributed in any form without prior written permission from WST. WST reserves the right at any time and without notice to change, amend, or cease publication of the information. This material has been prepared solely for informative purposes. The information contained herein may include information that has been obtained from third party sources and has not been independently verified. It is made available on an “as is” basis without warranty. This document is intended for clients for informational purposes only and should not be otherwise disseminated to other third parties. Past performance or results should not be taken as an indication or guarantee of future performance or results, and no representation or warranty, express or implied is made regarding future performance or results. This document does not constitute an offer to sell, or a solicitation of an offer to purchase, any security, future or other financial instrument or product.