
April 2020: Global Equity Market Review
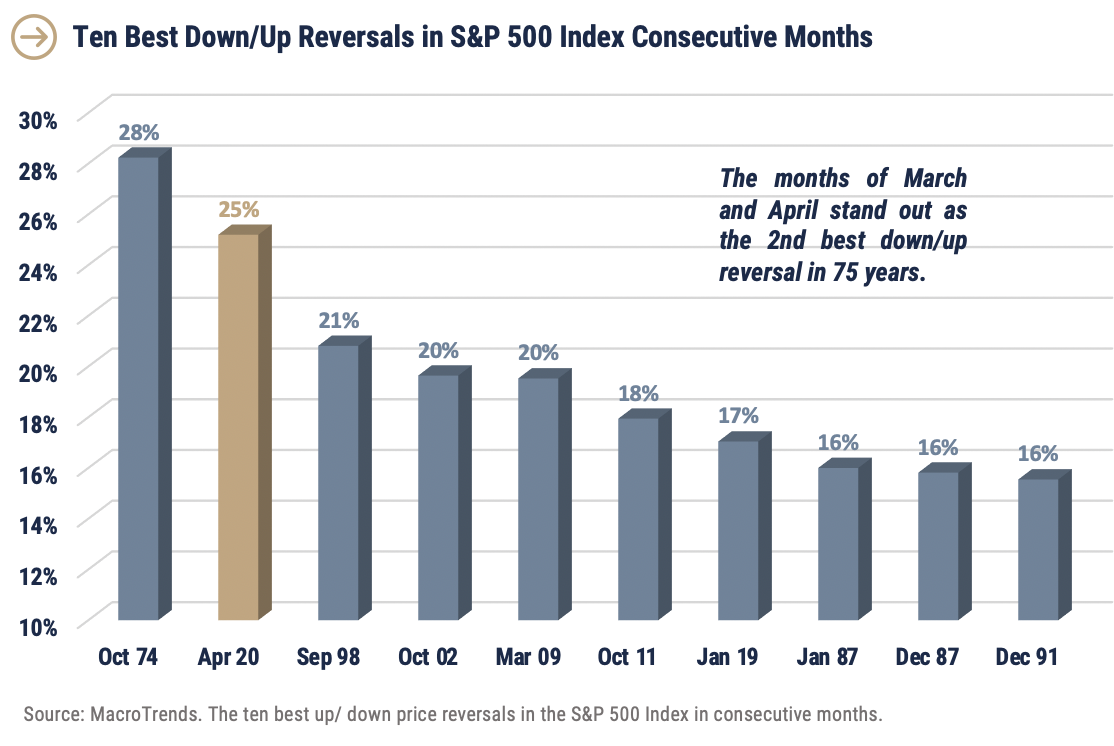
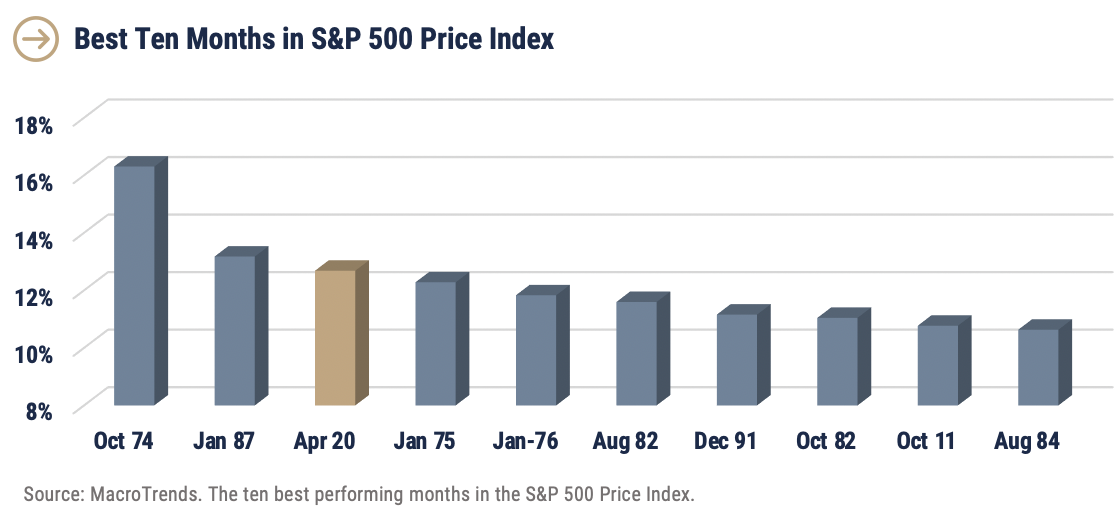
What a difference a month makes. A double-digit decline in the S&P 500 Index last month (-12.4%) was met with a comparable double-digit increase in April (+12.7%). Double-digit changes in either direction within a single month are not common – occurring in just 23 months over 75 years – and a pair of double-digit moves in consecutive months are quite rare – happening only once in 75 years (Sep/Oct 1974).
Answering the critical question, "What has changed to shift investor pessimism into optimism in such a short time?" leaves us less than confident on the about-face of equity investors. Of course, the dominant news story has been the COVID–19 pandemic. The news here is mixed at best with some progress on multiple vaccines moving through trials and one being brought to market (Remdesivir). The debate on reopening the economy intensifies with plenty of fodder on either side of the argument and no right answer in the trade-off between lives and livelihoods.
Other market metrics that would reinforce the legitimacy of April’s strength are also mixed. Many of the largest stocks recovered their March decline in April while the smaller stocks remain 10% or more below where they stood at February month-end. In an encouraging move, cyclical stocks rallied in April as plans were developed on reopening the economy. However, when combined with the March results, it is the defensive industry groups that are closer to their February month-end prices. A similar pattern can be observed in U.S. and non-U.S. markets with the large cap U.S. rally showing more strength in April than developed and emerging market international markets. Finally, it is worth noting Treasury yields in both 2- and 10-year maturities fell during a month when stocks rallied hard. With Treasury yields at multi-decade lows, it suggests stock and bond investors have opposing views about the strength and shape of an economic rebound.
We expect a further shift in the narrative on the economic impact of the COVID-19 crisis. The willingness of consumers and businesses to borrow at low rates will be driven by confidence in the future, which has been damaged by the shutdown. The Fed has acted swiftly and, in a manner, far in excess of steps taken during the Great Financial Crisis. But, the global nature of the crisis means the Fed cannot completely control the outcome or the decisions of borrowers in the months ahead. The lifelines extended in fiscal policy moves should also be applauded. The explosive growth of Federal debt, however, will sow the seeds of the long-term challenge of debt to GDP approaching the highest level in 75 years. The political rhetoric is sure to accelerate on the issue of fiscal responsibility as the November elections draw near.
Finally, it is worth noting the S&P 500 Index has a positive 0.9% return over the 12 months ended April. We find it implausible that the vast majority of equity investors consider the underlying fundamentals, which drive long term equity returns, the same as they were one year ago.
For more market updates, visit the WST blog.
Important Disclosures
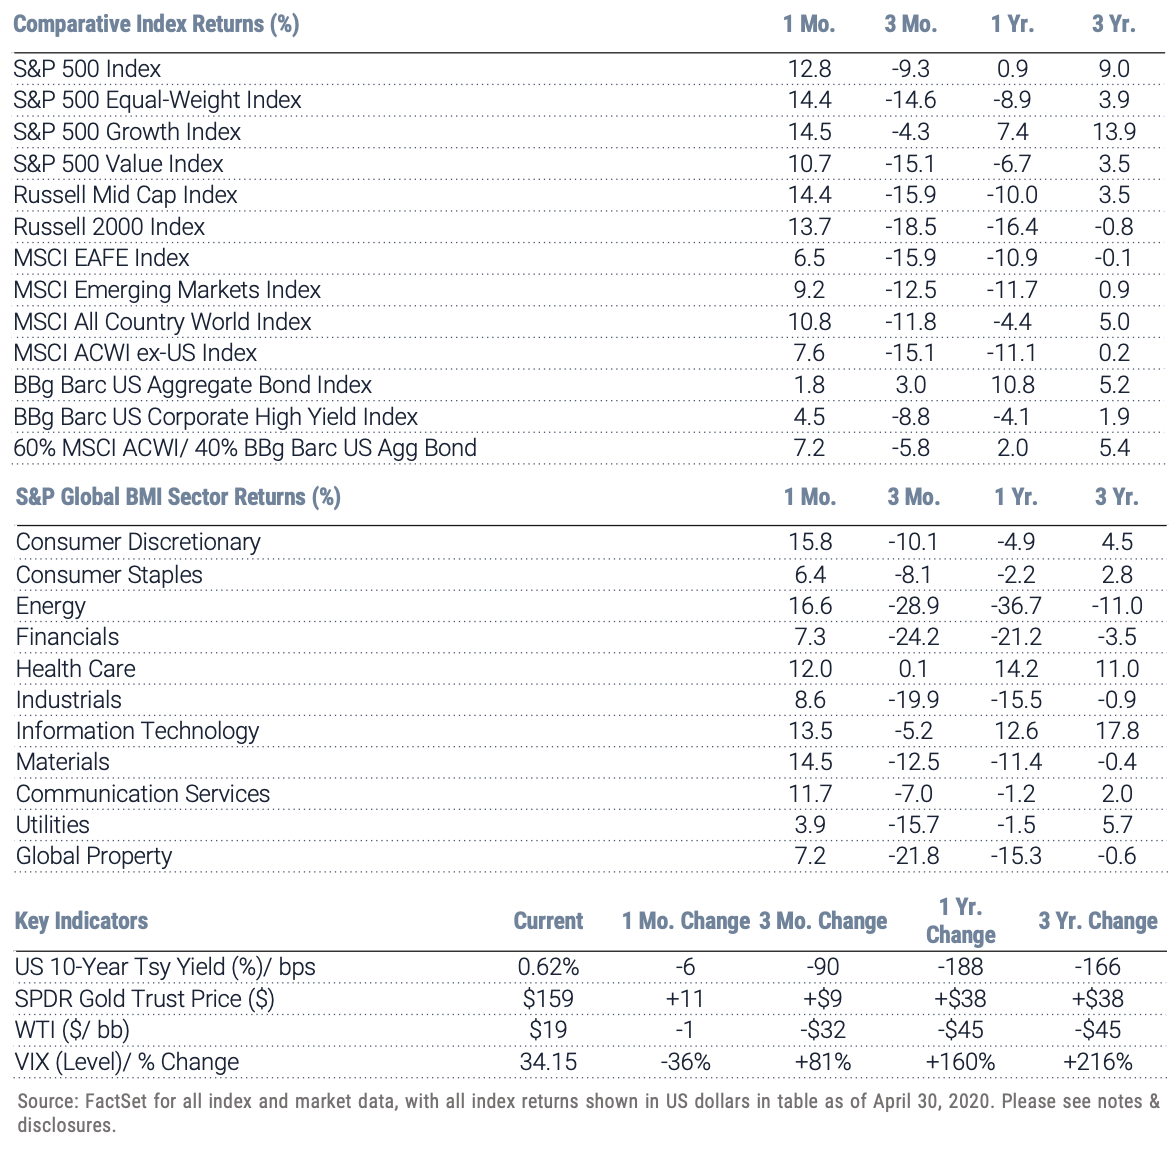
Index Returns – all shown in US dollars
All returns shown trailing 12/31/2019 for the period indicated. “YTD” refers to the total return as of prior-year end, while the other returns are annualized. 3-month and annualized returns are shown for:
- The S&P 500 index is comprised of large capitalized companies across many sectors and is generally regarded as representative of US stock market and is provided in this presentation in that regard only.
- The S&P 500® Equal Weight Index (EWI) is the equal-weight version of the widely-used S&P 500. The index includes the same constituents as the capitalization weighted S&P 500, but each company in the S&P 500 EWI is allocated a fixed weight - or 0.2% of the index total at each quarterly rebalance. The S&P 500 equal-weight index (S&P 500 EWI) series imposes equal weights on the index constituents included in the S&P 500 that are classified in the respective GICS® sector.
- The S&P 500 Growth Index is comprised of equities from the S&P 500 that exhibit strong growth characteristics and is weighted by market-capitalization.
- The S&P 500 Value Index is a market-capitalization weighted index comprising of equities from the S&P 500 that exhibit strong value characteristics such as book value to price ratio, cash flow to price ratio, sales to price ratio, and dividend yield.
- The Russell 3000 Index tracks the performance of 3000 U.S. corporations, determined by market-capitalization, and represents 98% of the investable equity market in the United States.
- The Russell Mid Cap Index measures the mid-cap segment performance of the U.S. equity market and is comprised of approximately 800 of the smallest securities based on current index membership and their market capitalization.
- The Russell 2000 Index is a market-capitalization weighted index that measures the performance of 2000 small-cap and mid-cap securities. The index was formulated to give investors an unbiased collection of the smallest tradable equities still meeting exchange listing requirements.
- The MSCI All Country World Index provides a measure of performance for the equity market throughout the world and is a free float-adjusted market capitalization weighted index.
- The MSCI EAFE Index is a market-capitalization weighted index and tracks the performance of small to large-cap equities in developed markets of Europe, Australasia, and the Far East.
- The MSCI Emerging Markets Index is a float-adjusted market-capitalization index that measures equity market performance in global emerging markets and cannot be purchased directly by investors.
- The S&P Global BMI sector indices are into sectors as defined by the widely used Global Industry Classification Standards (GICS) classifications. Each sector index comprises those companies included in the S&P Global BMI that are classified as members of respective GICS® sector. The S&P Global BMI Indices were introduced to provide a comprehensive benchmarking system for global equity investors. The S&P Global BMI is comprised of the S&P Emerging BMI and the S&P Developed BMI. It covers approximately 10,000 companies in 46 countries. To be considered for inclusion in the index, all listed stocks within the constituent country must have a float market capitalization of at least $100 million. For a country to be admitted, it must be politically stable and have legal property rights and procedures, among other criteria.
- The Barclay’s US Aggregate Index, a broad based unmanaged bond index that is generally considered to be representative of the performance of the investment grade, US dollar-denominated, fixed-rate taxable bond market.
- The Bloomberg Barclay’s US Corporate High Yield Index, which covers the USD-denominated, non-investment grade, fixed-rate, taxable corporate bond market.
Key Indicators
Key Indicators correspond to various macro-economic and rate-related data points that we consider impactful to equity markets.
- The US 10-Year Treasury Yield (%)/bps, is the return on investment for the U.S. government’s 10-year debt obligation and serves as a signal for investor confidence.
- SPDR Gold Trust Price ($), is an investment fund that reflects the performance on the price of a gold bullion, less the Trust’s expenses.
- West Texas Intermediate, which is an oil benchmark and the underlying asset in the New York Mercantile Exchange’s oil futures contract.
- CBOE Volatility Index (Level)/% Change, which uses price options on the S&P 500 to estimate the market's expectation of 30-day volatility.
This document is intended for informational purposes only and should not be otherwise disseminated to other third parties. Past performance or results should not be taken as an indication or guarantee of future performance or results, and no representation or warranty, express or implied is made regarding future performance or results. This document does not constitute an offer to sell, or a solicitation of an offer to purchase, any security, future or other financial instrument or product. This material is proprietary and being provided on a confidential basis, and may not be reproduced, transferred or distributed in any form without prior written permission from WST. WST reserves the right at any time and without notice to change, amend, or cease publication of the information. The information contained herein includes information that has been obtained from third party sources and has not been independently verified. It is made available on an "as is" basis without warranty and does not represent the performance of any specific investment strategy.
We consider an index to be a portfolio of securities whose composition and proportions are derived from a rules-based model. You cannot invest directly in an index and the performance of an index does not represent the performance of any specific investment. Some of the information enclosed may represent opinions of WST and are subject to change from time to time and do not constitute a recommendation to purchase and sale any security nor to engage in any particular investment strategy.
Besides attributed information, this material is proprietary and may not be reproduced, transferred or distributed in any form without prior written permission from WST. WST reserves the right at any time and without notice to change, amend, or cease publication of the information. This material has been prepared solely for informative purposes. The information contained herein may include information that has been obtained from third party sources and has not been independently verified. It is made available on an “as is” basis without warranty. This document is intended for clients for informational purposes only and should not be otherwise disseminated to other third parties. Past performance or results should not be taken as an indication or guarantee of future performance or results, and no representation or warranty, express or implied is made regarding future performance or results. This document does not constitute an offer to sell, or a solicitation of an offer to purchase, any security, future or other financial instrument or product.