3Q 2022 | Markets & Economic Overview
“I think we now understand better how little we understand about inflation.” - Jerome Powell | Federal Reserve Chairman
“The sea is dangerous and its storms terrible, but these obstacles have never been sufficient reason to remain ashore." -Ferdinand Magellan
The third quarter brought more challenges for investors as markets responded to the turbulent geopolitical picture, stubbornly high inflation, and increasingly hawkish positioning by global central banks.
The overarching concern gripping markets today is the rising risk of recession due to the Fed’s determined efforts to quell inflation in the U.S., even at the risk of a sharp slowdown in economic activity. The Fed’s stated hope for a "soft landing" of the U.S. economy reminds many investors of Chairman Powell’s earlier expectation of "transitory inflation," both are vague terms that demonstrate the difficulties inherent in predicting economic trends, even for central bankers. As inflation and recession risks rose both stocks and bonds declined again this quarter, continuing the unusual correlation we discussed last quarter with asset classes normally considered safe havens declining right along with risky ones.
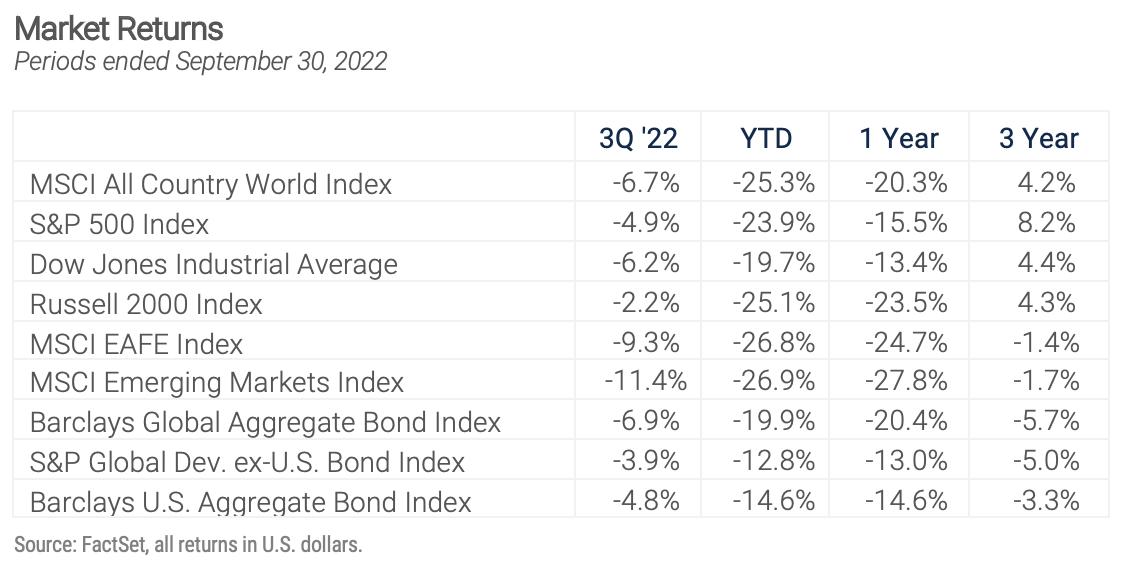
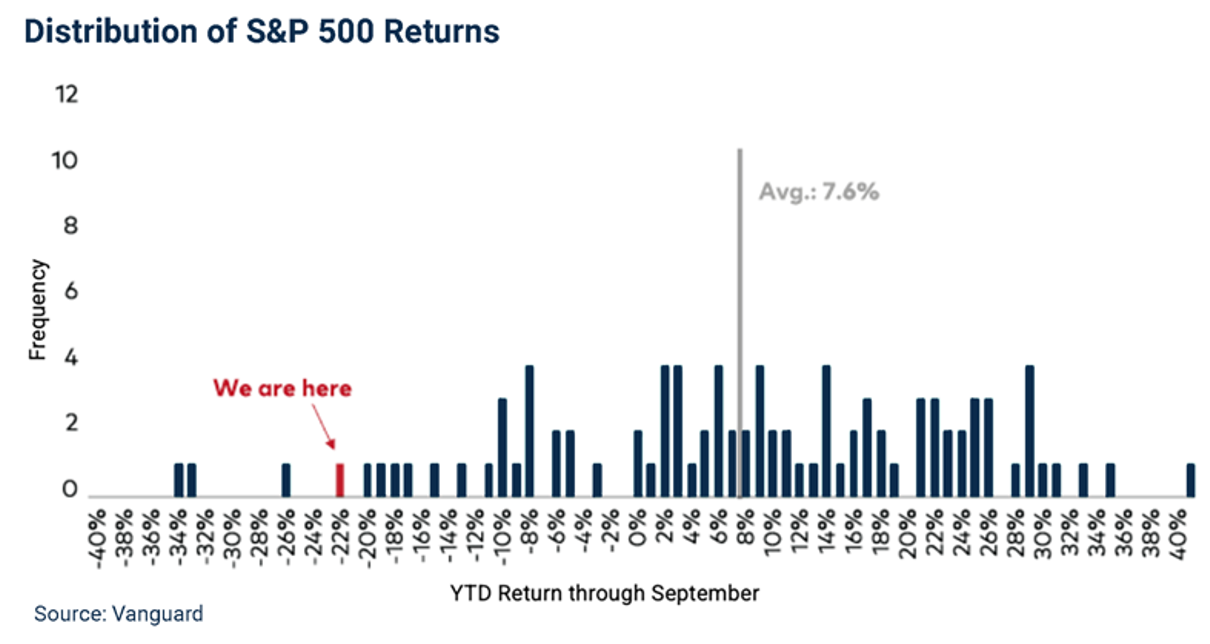
As we enter the fourth quarter, 2022’s year-to-date returns rank among the worst on record for both stocks and bonds. Through September the S&P 500 is down 23.9% after a 4.9% drop in the third quarter, and the global equity market as measured by the All-Country World Index (ACWI) was down 6.7% for the quarter and is now down 25.3% for 2022. As the chart below reveals, the nine-month year-to-date return for the S&P 500 is the fourth worst start to a calendar year since 1928.
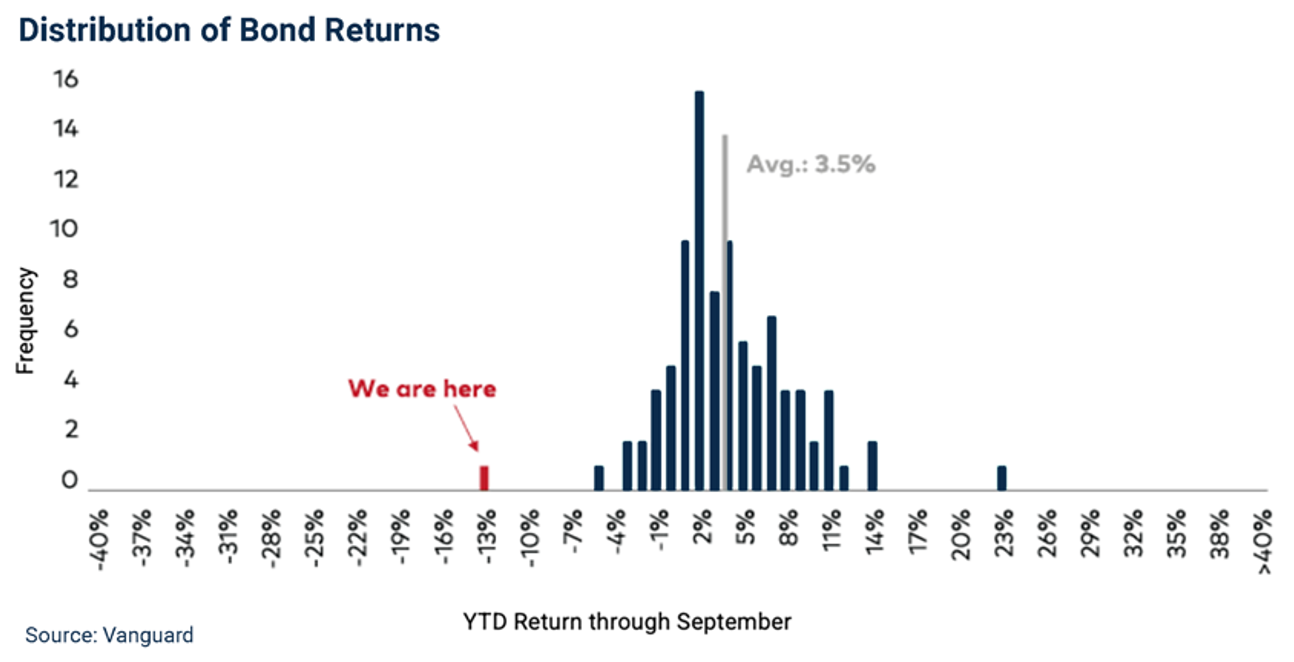
From an historical perspective fixed income returns were even worse. Throughout 2022 the focus of bond investors has been tighter monetary policy and the Fed's evolving commitment to prioritizing the inflation fight. As we detail below in the Fixed Income section the front end of the yield curve has seen the most dramatic moves as high inflation readings induced aggressive action by the Fed, but rates rose across all maturities last quarter. As interest rates rose bond prices declined, continuing their dismal year with the Bloomberg U.S. Aggregate bond index enduring a total return including income of -4.8% for the quarter and -14.6% for the year-to-date, the worst ever nine-month start to a year for the fixed income markets.
Given the speed and magnitude of the changes in the underlying economic fundamentals, the range of possible outcomes for the markets is broad. Certainly, global growth is slowing. For now, the Fed’s willingness to accept collateral damage in the form of higher unemployment and even a recession in its war against inflation is seen as a reasonable trade-off; some pain is to be expected, but the length and depth of the coming downturn will determine the markets’ ultimate response. It’s been said the Fed raises rates “until something breaks,” and the risk of an overshoot on tightening is high.
From a big-picture perspective, the macro shifts underway in the global economy and the transition to a new economic era accelerated this quarter. To a large extent, the global economy was driven by two strong tailwinds over the past 40 years, and both have become headwinds in 2022. The first new headwind is rising interest rates. Since inflation and interest rates peaked in the early 1980s with the CPI at 14.6% and the Fed funds rate at 19.1%, a long, steady decline in borrowing costs encouraged consumers to spend, fostered innovation and capital investment, and boosted growth across almost all industries. Now, with the Fed raising rates at an unprecedented pace in its determined effort to dampen inflation, consumer demand and corporate investment are beginning to suffer.
Today’s stubbornly high inflation is driven, at least partially, by the second headwind, deglobalization. The fall of the Berlin Wall in November 1989 symbolically ushered in an era of cross-border and transoceanic economic cooperation and investment that opened new markets and created efficiencies in the sourcing of energy and raw materials and the production and distribution of goods. Now the expanding and intensifying conflict in Ukraine and Russia, and the looming energy crisis threatening Europe as a result, are the most obvious and immediate drivers of deglobalization.
As we’ve written in prior letters our trade battles with China over tariffs, intellectual property and technology are another important factor in deglobalization. According to the World Bank the volume of global trade increased more than twice as fast as world GDP during the two decades between the fall of the Berlin Wall and the onset of the global financial crisis in 2008. As trade liberalization drove investment in both developed and emerging economies around the world, and China's economic reforms brought it into the mainstream of the global trade community, improved productivity and better access to raw material supplies reduced production costs in a wide range of industries. Low-cost imports had a direct disinflationary impact on the prices of goods globally. These trends continued until geopolitical tensions and rising national security concerns led to trade conflicts and ultimately to the tariffs imposed on Chinese imports by the U.S. and others. Tariffs are simply taxes on trade, and the timing of the recent round of tariff increases was unfortunate because their inflationary impact was exacerbated by the supply chain bottlenecks caused by COVID.
So, the Fed’s effort to slow inflation after years of pumping liquidity into the economy is complicated because the inflationary impacts of deglobalization and high energy prices are not easily offset by short-term interest rate policy in the U.S.
EQUITY MARKET OVERVIEW
The summer rally which saw stocks rise 17% and brought the indexes halfway back from their lows of the year reversed in mid-August, dimming the prospects of positive returns in 2022. The July gains were driven by the hope inflation had peaked and would allow the Fed to moderate the pace of rate hikes, and that hope was dashed when the August PCE price index, the Fed's preferred metric of inflation pressures, rose 6.2%. That number was down slightly from the June and July readings, but still higher than expected and reflective of the persistent nature of this bout of inflation. Markets responded as expected and the three major U.S. stock indexes all ended the quarter at their lowest levels since 2020. The Dow Jones Industrial Average was down 19.7% for the year, the S&P 500 down 23.9%, and the NASDAQ composite down 32%.
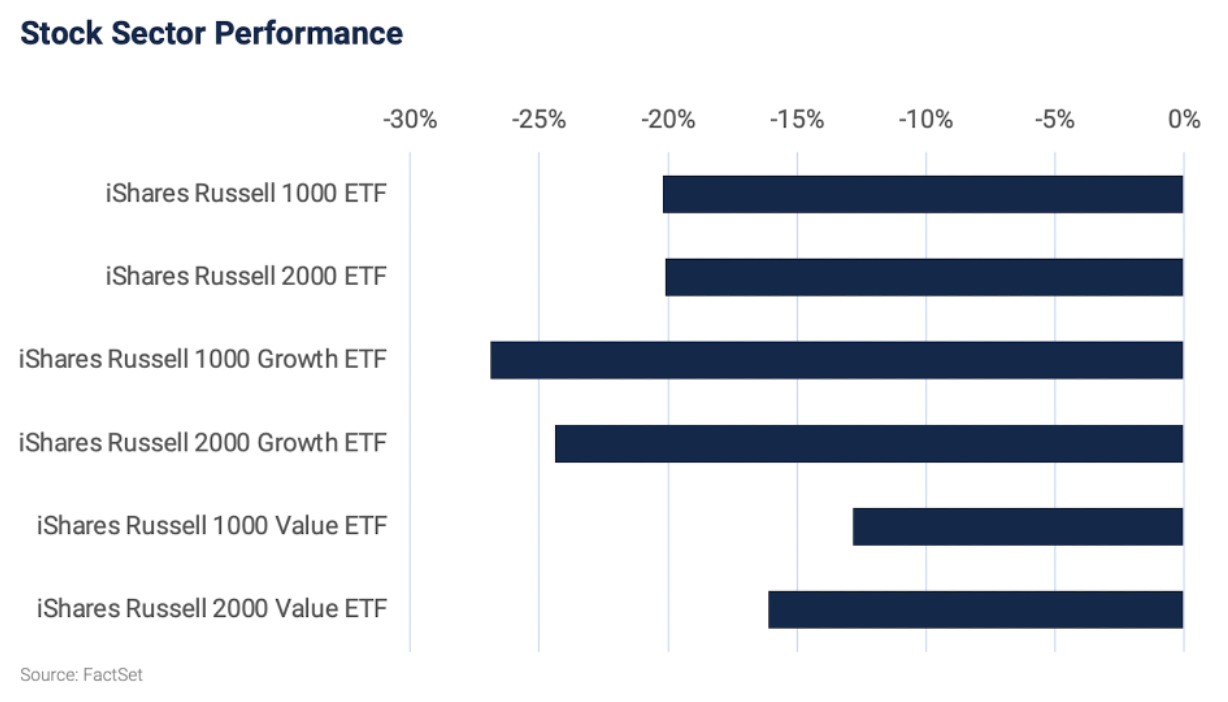
A quick glance at equity performance by style, size, and geography this year reveals the pattern normally associated with periods of market stress. Large-cap stocks have held up better in 2022 than small-caps, value stocks better than growth, and domestic stocks benefited from the relative safety of the U.S. economy and the stronger dollar.
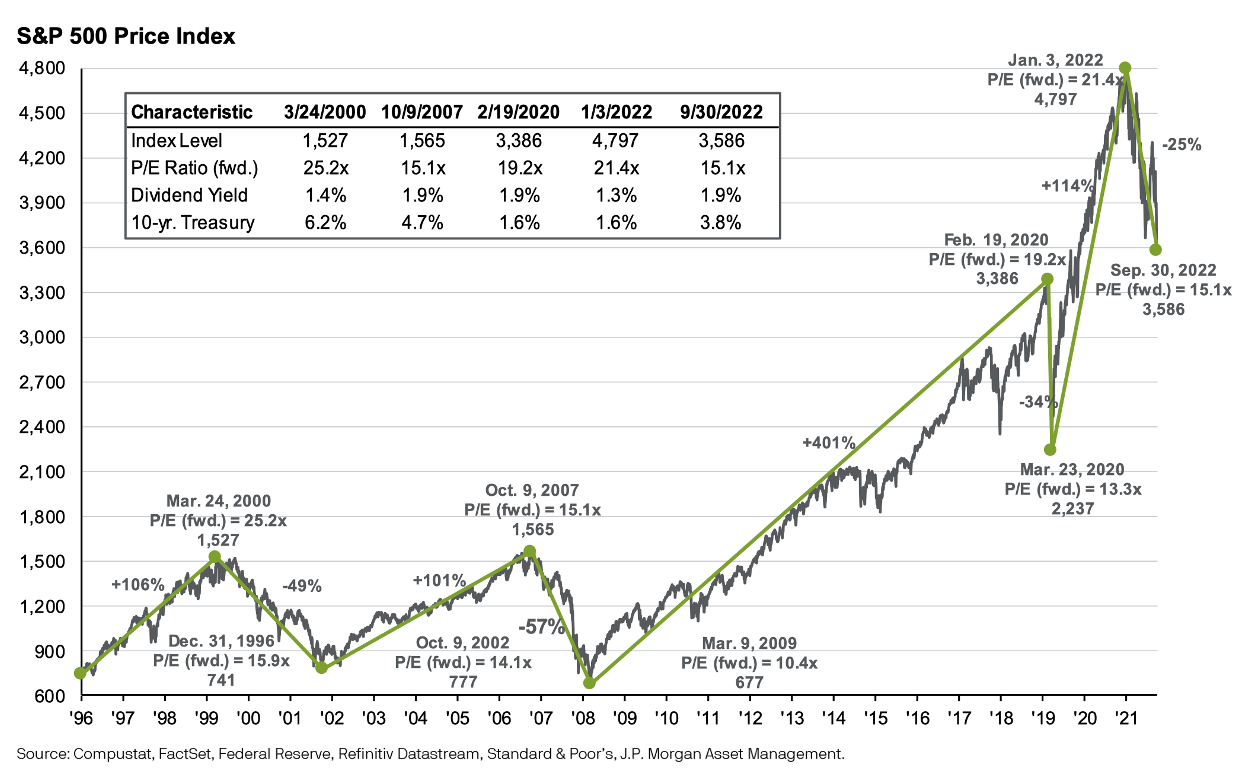
With stock prices down investors are beginning to look for bargains, but equity valuations are still not cheap relative to historical levels. The most common metric of value in the stock market is the price/earnings ratio, and while the P/E ratio of the S&P 500 has fallen we’re concerned about the earnings outlook, which doesn’t reflect fully the rising risk of recession. U.S. corporate profits have held up remarkably well considering the circumstances, but they face important hurdles heading into the fourth quarter and 2023. Rising prices for commodities and other inputs are difficult for companies to pass on fully to customers, so if inflation remains high profits will be weaker. The strength of the dollar is also a big concern for the multinational companies that populate the S&P 500, because a stronger U.S. currency makes their products more expensive overseas and reduces the value of their foreign revenues. According to the Wall Street Journal, large technology companies generate more than half of their revenue outside the U.S., so they are particularly vulnerable to the strong dollar. Rising labor costs associated with the tight job market are another important factor because labor is the biggest expense for many businesses.
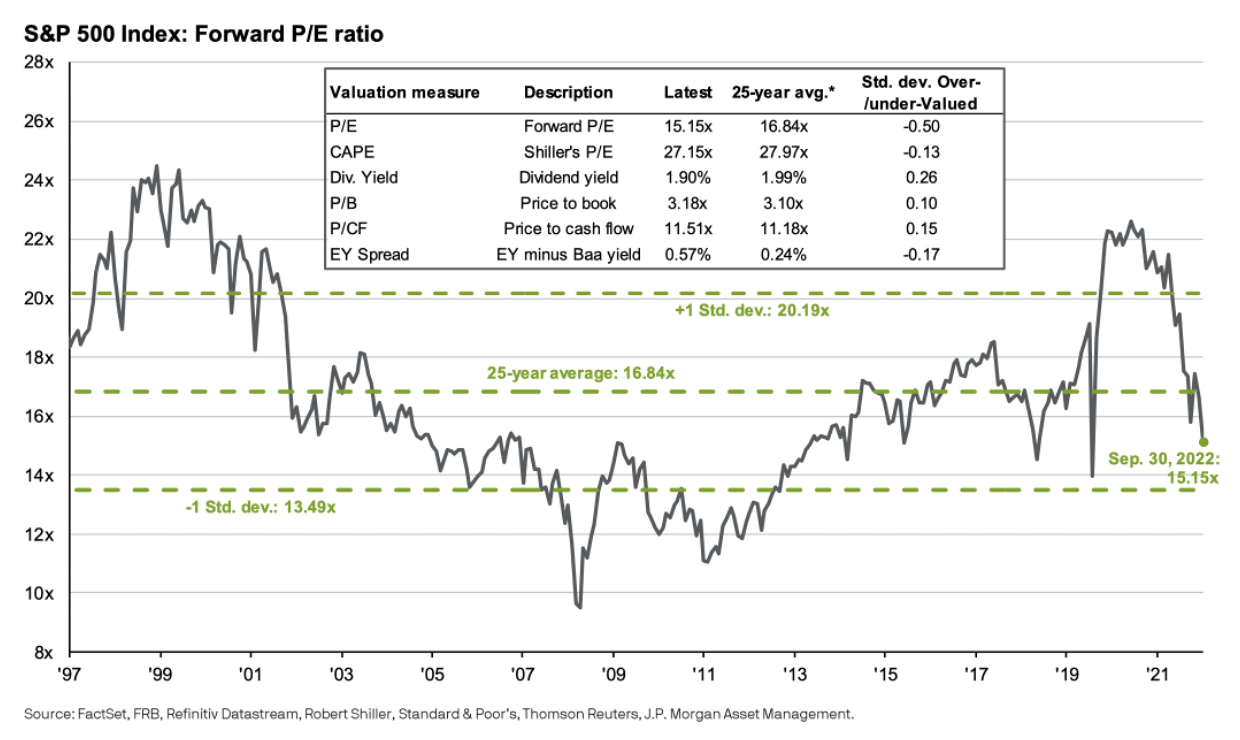
Given that backdrop, corporate earnings will be watched closely in coming months. As the preceding graph reveals the S&P 500 is trading at just over 15 times the 2022 consensus earnings estimate of $235 per share, slightly below the long-term average of 16.8, and 14 times the $255 per share estimate for the full year 2023. The 2023 estimate assumes 8% profit growth over the next 12 months. So, stocks are reasonably priced but not cheap even based upon that strong growth estimate, and certainly would be vulnerable to a recession-driven earnings decline.
BOND MARKET OVERVIEW
As we mentioned at the outset fixed income markets have changed dramatically in 2022. Bond yields rose sharply across the entire spectrum of maturities during the third quarter, deepening the losses in what is on pace to be the worst year for fixed income since records began. The total return for the 30-year Treasury Bond in 2022 through September 30 was an astonishing -24%, and the Barclays U.S. Aggregate Bond Index, the most common point of reference for fixed income investors, was down 14.6%. Short-term yields are at their highest level since 2007, and the one-year Treasury yield reached highest level since 2001 when it surpassed 4% in late September.
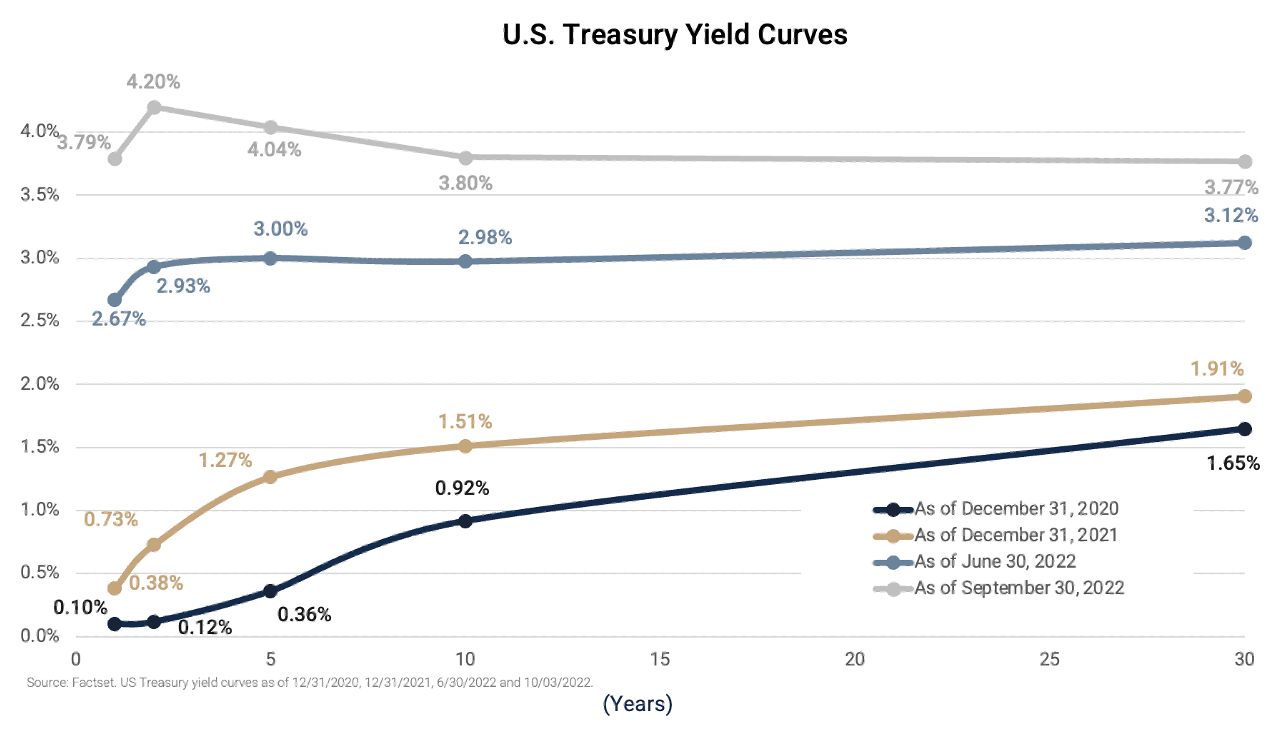
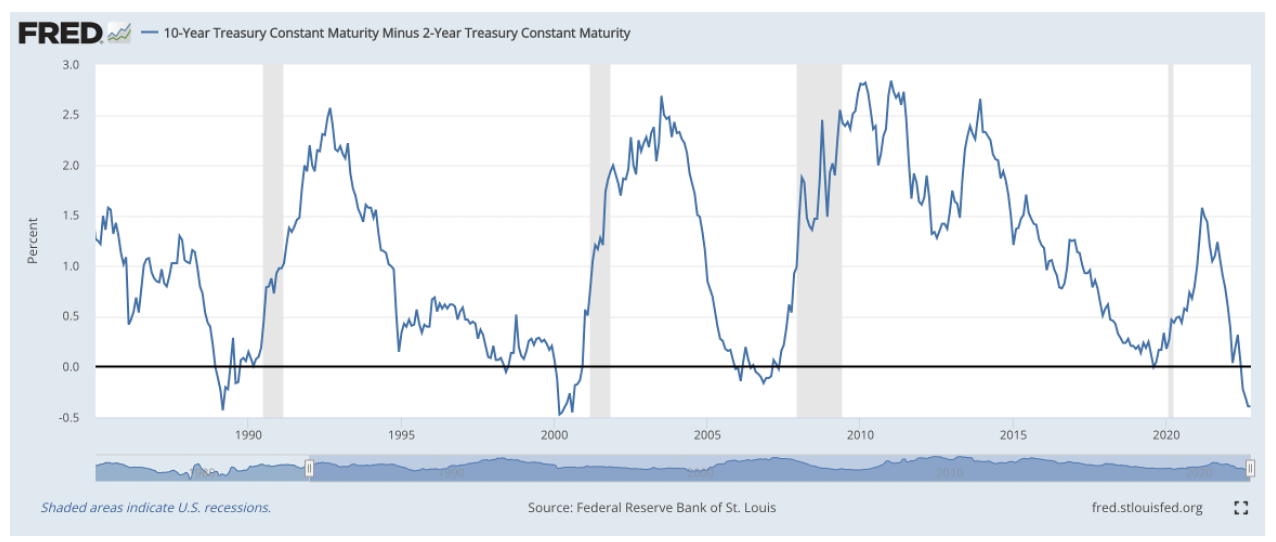
As important as the absolute level of yields is the shape of the yield curve, which as of September 30 was inverted from two years out to 30, and the closely watched two-year/10-year yield spread stood at a gaping -45 basis points. That gap reflects heightened recession fears; the high short-term rate reflects the market expectation of continued Fed rate hikes while the lower long-term rate indicates an expectation of slower growth and lower inflation down the road. As the graph below reveals a negative two-year/10-year spread has predicted each of the last three recessions.
WHY NOT SIT THIS ONE OUT?
Given the challenges facing investors: high inflation, rising interest rates, recession risks, equity valuations that may still be too high, etc. some might ask "why not just sit this one out?"
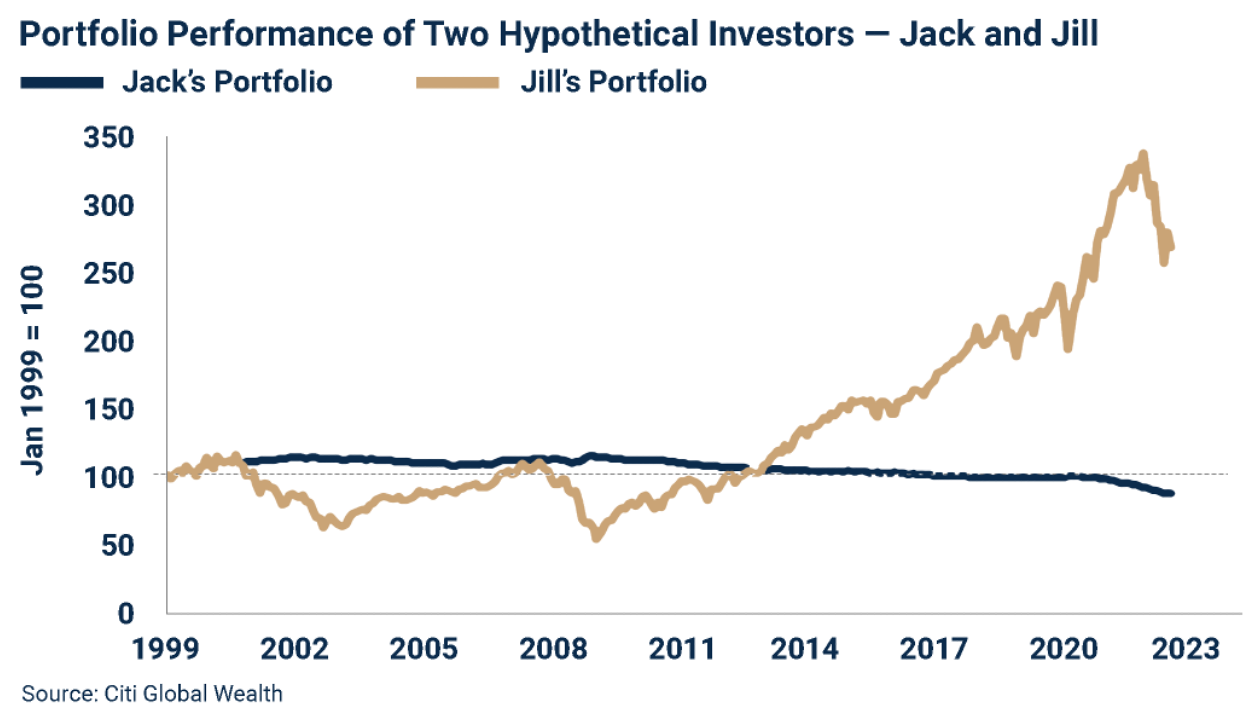
At the end of September Citi Global Wealth’s CIO David Bailin published a note with that title, “Why Not Sit This One Out?”[1] That note laid out compelling data to encourage long-term thinking during bear markets. It compared the experience of two hypothetical investors, Jack and Jill. Jack had the prescience to recognize the overvaluation of U.S. equities in 2000 and liquidated his portfolio with perfect timing in February of that year, investing the proceeds in Treasury Bills. Jill invested the same amount of money Jack did, but she maintained her all-equity portfolio through September 2022. Her portfolio declined 49% in 2000-2002 when the Internet bubble burst and 51% in 2008-2009 during the Great Financial Crisis. Even so, and even after a 20% decline this year, Jill has three times as much money in real terms as Jack does.
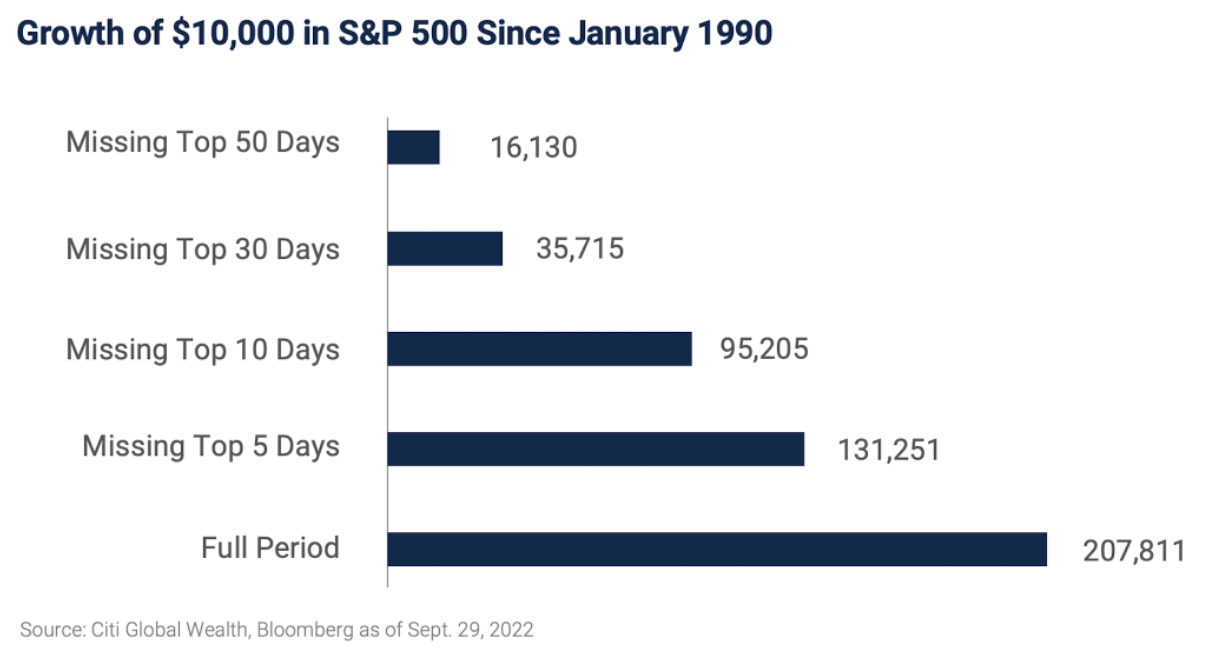
As Mr. Bailin points out in his note there are several reasons why "going to cash" is a costly decision over the long run. The most important is the risk of missing the markets’ best days when a large proportion of long-term returns are earned. The graph below demonstrates the damage done to wealth creation when market timing fails. Missing just the top five days of market returns over the past 22 years reduced an investors final wealth by almost 1/3, and missing just the top 10 days cut final wealth in half. Not coincidentally the best days in the market often occur after large declines.
Obviously, not all investors have a 32-year time horizon. Maintaining sufficient liquidity to meet short term needs is important, and even in a year where the bond market has been mauled balanced accounts have been protected some by asset class diversification. Despite the challenging short term outlook this bear market, like all in the past, will ultimately be viewed in retrospect as a time to remain disciplined and rebalance opportunistically. Interest rate increases, particularly in the short end of the yield curve, now allow us to rotate into highly rated short-term bonds to generate more income with less risk. And at current levels stocks offer a much more attractive entry point than they did in December.
[1] Bailin, David, Why Not Sit This One Out? Citi Global Wealth CIO Strategy Bulletin, October 2, 2022
SUMMARY
Just as we said at the close of last quarter, the inevitable periods of poor performance in the markets provide us an opportunity to revisit the fundamentals of sound investing and to check in on each client's needs and objectives. The timeless fundamentals of diversification, thinking long-term, and avoiding emotional decisions don't obviate the need for ongoing consideration of and discussions about changes in portfolio positioning and holdings to ensure that the mix of assets held in any client’s account is aligned to meet both short and long-term objectives. Times like these are thought-provoking for all, making good communication about asset allocation and cash flow planning all the more important.
Notes & Disclosures
Wilbanks, Smith & Thomas Asset Management (WST) is an investment adviser registered under the Investment Advisers Act of 1940. Registration as an investment adviser does not imply any level of skill or training. The information presented in the material is general in nature and is not designed to address your investment objectives, financial situation, or particular needs. Prior to making any investment decision, you should assess, or seek advice from a professional regarding whether any particular transaction is relevant or appropriate to your individual circumstances. This material is not intended to replace the advice of a qualified tax advisor, attorney, or accountant. Consultation with the appropriate professional should be done before any financial commitments regarding the issues related to the situation are made.
This document is intended for informational purposes only and should not be otherwise disseminated to other third parties. Past performance or results should not be taken as an indication or guarantee of future performance or results, and no representation or warranty, express or implied is made regarding future performance or results. This document does not constitute an offer to sell, or a solicitation of an offer to purchase, any security, future or other financial instrument or product. This material is proprietary and being provided on a confidential basis, and may not be reproduced, transferred, or distributed in any form without prior written permission from WST. WST reserves the right at any time and without notice to change, amend, or cease publication of the information. The information contained herein includes information that has been obtained from third-party sources and has not been independently verified. It is made available on an "as is" basis without warranty and does not represent the performance of any specific investment strategy.
Some of the information enclosed may represent opinions of WST and are subject to change from time to time and do not constitute a recommendation to purchase and sale any security nor to engage in any particular investment strategy. The information contained herein has been obtained from sources believed to be reliable but cannot be guaranteed for accuracy.
Besides attributed information, this material is proprietary and may not be reproduced, transferred or distributed in any form without prior written permission from WST. WST reserves the right at any time and without notice to change, amend, or cease publication of the information. This material has been prepared solely for informative purposes. The information contained herein may include information that has been obtained from third party sources and has not been independently verified. It is made available on an “as is” basis without warranty. This document is intended for clients for informational purposes only and should not be otherwise disseminated to other third parties. Past performance or results should not be taken as an indication or guarantee of future performance or results, and no representation or warranty, express or implied is made regarding future performance or results. This document does not constitute an offer to sell, or a solicitation of an offer to purchase, any security, future or other financial instrument or product.