
3Q 2021 | Quarterly Economic & Markets Review
“Inflation is when you pay fifteen dollars for the ten-dollar haircut you used to get for five dollars when you had hair.” -Sam Ewing
“Some say the world will end in fire, Some say in ice….” -Robert Frost
Investment markets proved resilient for most of the third quarter as generally positive economic data supported the gains earned during the first half of the year despite the resurgence of COVID-19 cases. After a relatively calm summer volatility spiked in September when investor focus shifted to the litany of risks the markets face in coming months, setting the stage for an interesting fourth quarter. Reading the tea leaves of the economy is a process always fraught with uncertainty, but the lingering impact of the government’s policy responses to the COVID-19 pandemic have led to data distortions that make the view of the future particularly opaque now.
Despite September’s volatility investments across the spectrum of asset classes are still trading at valuation levels that imply confidence in the ongoing health of the global economy and the dependability of supportive fiscal and monetary policies. That confidence was shaken a bit at the end of the third quarter by a slowdown in global GDP growth, stubbornly high inflation data, and seemingly intractable political wrangling in Washington. As we write this letter a high-stakes game of chicken is underway in the U.S. Capitol as lawmakers wrangle over the debt ceiling, the $1.0 trillion infrastructure bill and the broader $3.5 trillion budget blueprint. Certainly, we would not expect the U.S. government to default on its debt, but the inability of our leaders to come to terms on these important issues reflects the broad dysfunction of the polarized Congress.
As was the case last quarter the most important fundamental questions investors face involve the path of inflation and, closely related, Fed policy. Over the course of 2021 demand has surged as the global economy reopened and consumption has been supercharged by fiscal policies aimed at stimulating consumer spending. This surge in demand, coupled with labor shortages in critical areas (labor shortages driven at least in part by those very fiscal policies,) have created supply chain bottlenecks and driven inflation rates to levels last seen in the 1970s. In “normal” times inflation readings in the 4% to 5% range would be met with quick action by the Fed, but with uncertainty still surrounding the path of the recovery the Fed remains ostensibly committed to its accommodative policy. The inconsistent recent data makes the Fed’s course more unpredictable. Given the uptick in the CPI to 5.4% in September it is now widely expected to begin scaling back the $120 billion in monthly purchases of Treasury and mortgage bonds begun in June 2020 in the fourth quarter. The pace of the tapering and the timing of the inevitable first increase in the Fed Funds Rate will be closely watched by the markets. To the extent the amazing economic and market recoveries over the past 18 months were driven by fiscal and monetary stimulus, it stands to reason that the removal of that stimulus could have negative implications for the next cycle.
A potentially important economic wildcard emerged late in the third quarter with the news of the possible default of Evergrande, the second largest property developer in China. Like other developers Evergrande expanded rapidly for years as China's economy boomed, and now as growth moderates the extent of the company's leverage has been revealed. Originally understood to be struggling under a potentially crushing debt load of over $300 billion, Evergrande is now thought to be burdened by billions of dollars more in off balance sheet debt. JPMorgan estimates the company's total debt to equity is over 175% as opposed to the 100% originally reported. Economists agree that Evergrande’s default or collapse would be the biggest test China's financial system has faced in years. The company owns more than 1,300 real estate projects in over 280 cities and employs over 200,000 people in China according to CNBC. Obviously, the collapse of an entity that size would have fallout beyond China as Evergrande's debt is held by bond holders around the world, not to mention the potential damage to investor sentiment a default would cause.
Morgan Stanley chief investment officer Michael Wilson has framed the risks facing the markets now with the analogy of “fire and ice.” The “fire” scenario involves faster and more persistent inflation than the transitory price pressure expected by Fed Chairman Powell. That outcome, which seems increasingly likely, would force the Fed's hand and lead them to take a more aggressive path than the market now expects. It would accelerate the end of quantitative easing and could prompt the Fed to raise its overnight lending rate off its current rock bottom range of 0% to 0.25% sooner than expected. In this scenario investors will likely take heed of the dictum which advises “don't fight the Fed,” resulting in rising interest rates and price pressure across asset classes. The “ice” scenario projects a continued slowdown in global growth with supply chain issues and other factors exacerbating the margin pressures already beginning to dampen corporate earnings expectations.
Both the “fire” and the “ice” scenarios raise concerns today, but the scariest possibility would be a period of “stagflation,” defined as slow economic growth and high unemployment coupled with rising prices. The U.S. economy hasn’t endured stagflation since the energy crisis in the 1970’s. It’s an unusual phenomenon because inflation is rare during periods of weak growth, but today's economic crosswinds include wage pressures despite high unemployment, price pressure on products ranging from commodities to finished goods due to the supply chain backups, and persistently high energy prices. Energy prices pose a particularly important threat to the economy at this stage of the recovery because rising costs for gasoline, natural gas, and heating oil push inflation numbers higher while dampening demand by crowding out consumer spending on other goods and services. As of mid-October U.S. consumers are paying an average on $3.29 per gallon for gasoline, the highest level in seven years.
Equity Market Overview
Stocks moved steadily higher in July and August as the U.S. economy returned to pre-pandemic levels of output and second quarter earnings results, released in mid to late July, beat expectations. Fed Chair Jerome Powell boosted sentiment throughout the quarter by reiterating his commitment to maintaining full Fed support for the markets through the end of the year despite the progress of the economy and rising inflation. As we mentioned politics and fiscal policy took the spotlight in August when the Senate passed the $3.5 trillion reconciliation bill, but investors remained relatively sanguine, and stocks ended August close to record highs. Sentiment began to fade in September as the outlook for important market fundamentals came into question. Supply chain constraints and pockets of higher inflation led to margin compression and profit warnings in many industries, dampening the robust earnings outlook that has supported the remarkable post-COVID rally.
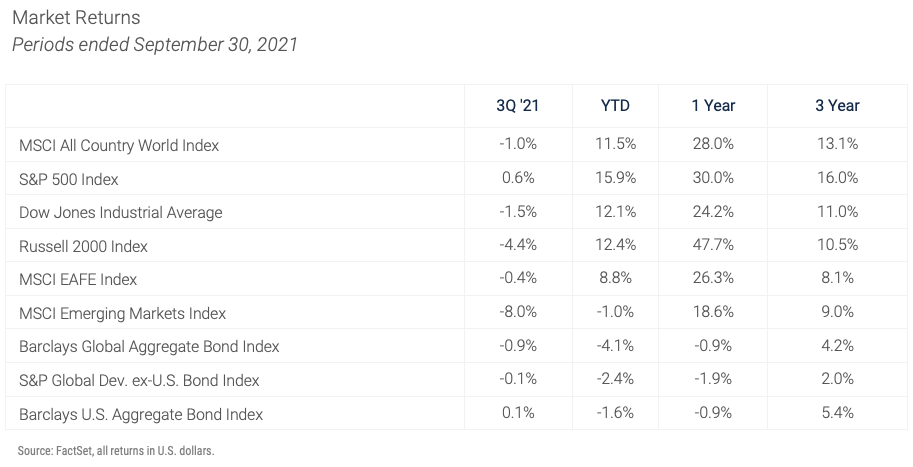
The last week of the quarter had a significant impact on returns. The S&P 500 dropped 2% that week, bringing its decline for September to 4.7% and reversing almost all the progress made in July and August. Those segments of the market most sensitive to the economy fared worst. Large cap value stocks (Russell 1000 Value) ended the quarter down almost 1%, Small cap stocks (Russell 2000) were down 4.4%, and Emerging Markets stocks (MSCI Emerging Markets index) declined 8%. EM equities were down initially because of concerns about resurgent COVID’s impact on the global economy, and those concerns were exacerbated by China-specific growth worries stemming from the Evergrande debt situation.
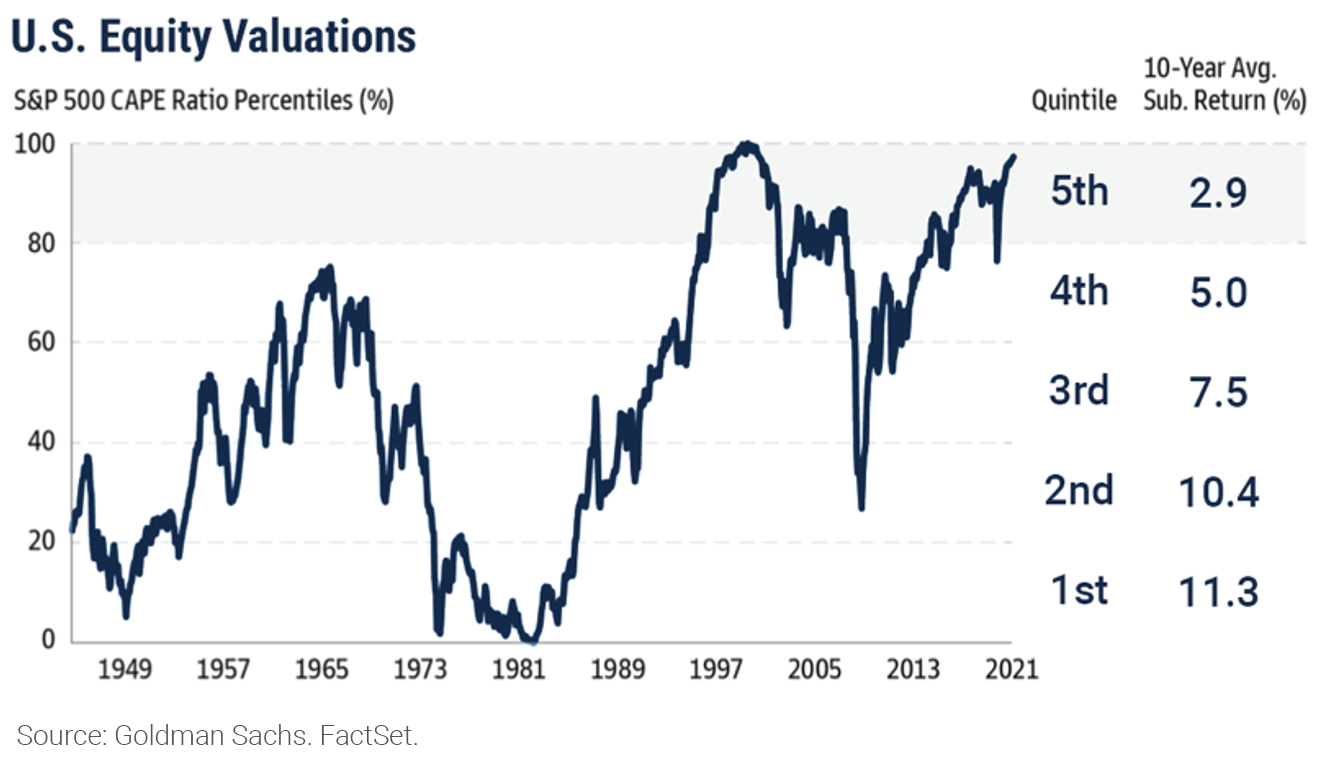
Despite the weakness at the end of the quarter the S&P 500 closed September with a 15.9% year-to-date return, and stocks at these levels leave very little margin for error. The graph below, courtesy of Goldman Sachs Asset Management, depicts the lofty valuation at which the S&P 500 trades today and reveals the muted returns historically provided by the index after reaching this level. Of course, this time could be different, but the relationship between stock valuations and subsequent returns is clear and applies to most investment asset classes; the more expensive an investment is at a given moment the lower the expected future return.
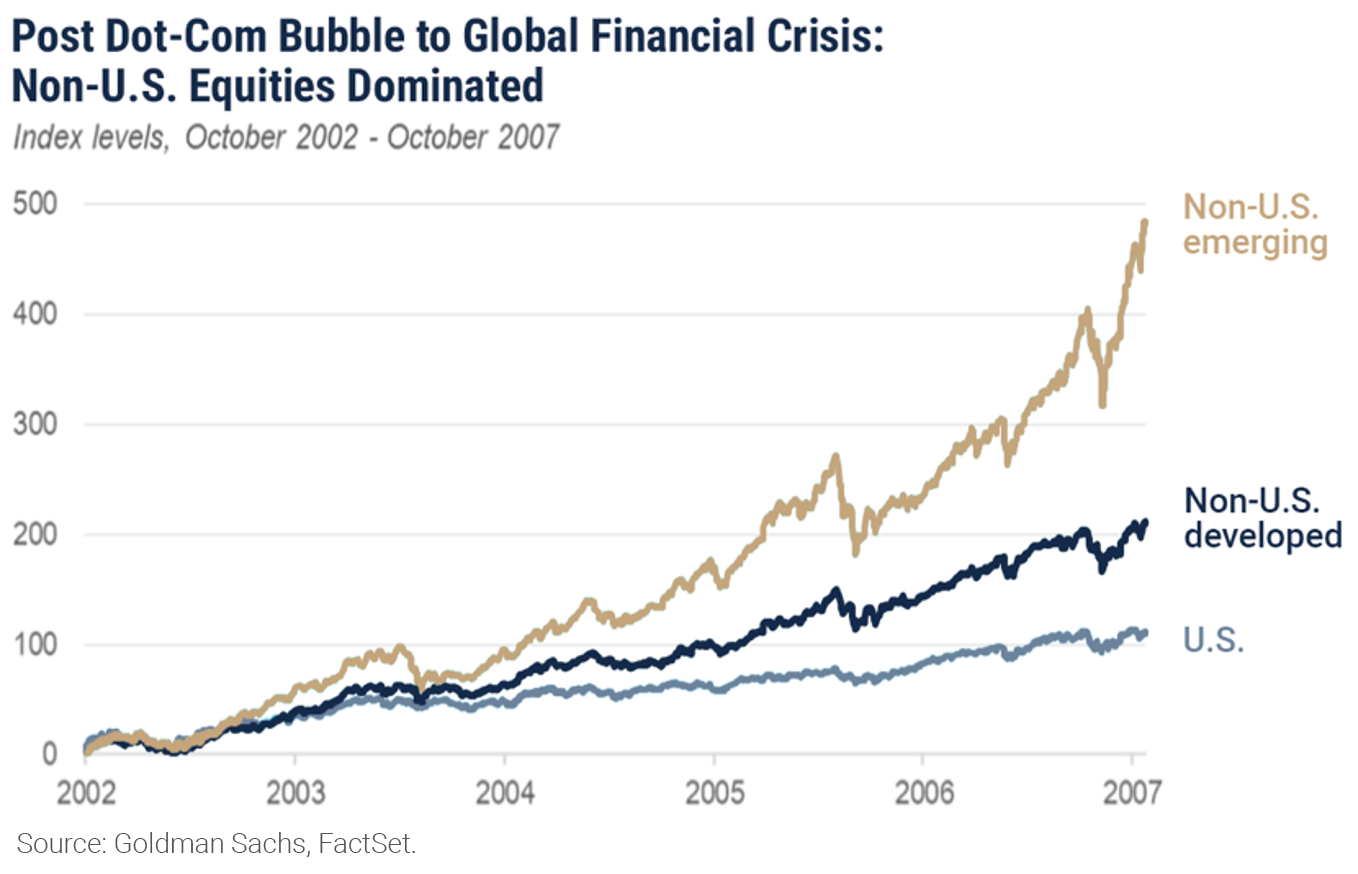
With both developed and emerging non-U.S. equities enduring another quarter of underperformance, the time is right for us to revisit the fundamental case for maintaining international portfolio allocations. We recognize patience is required, but cycles of performance by geography tend to last for years. The last period of outperformance by foreign equities began in the wake of the dot-com bubble in 2002 and lasted until the global financial crisis. During that time frame emerging markets equities generated returns five times those of U.S. equities.
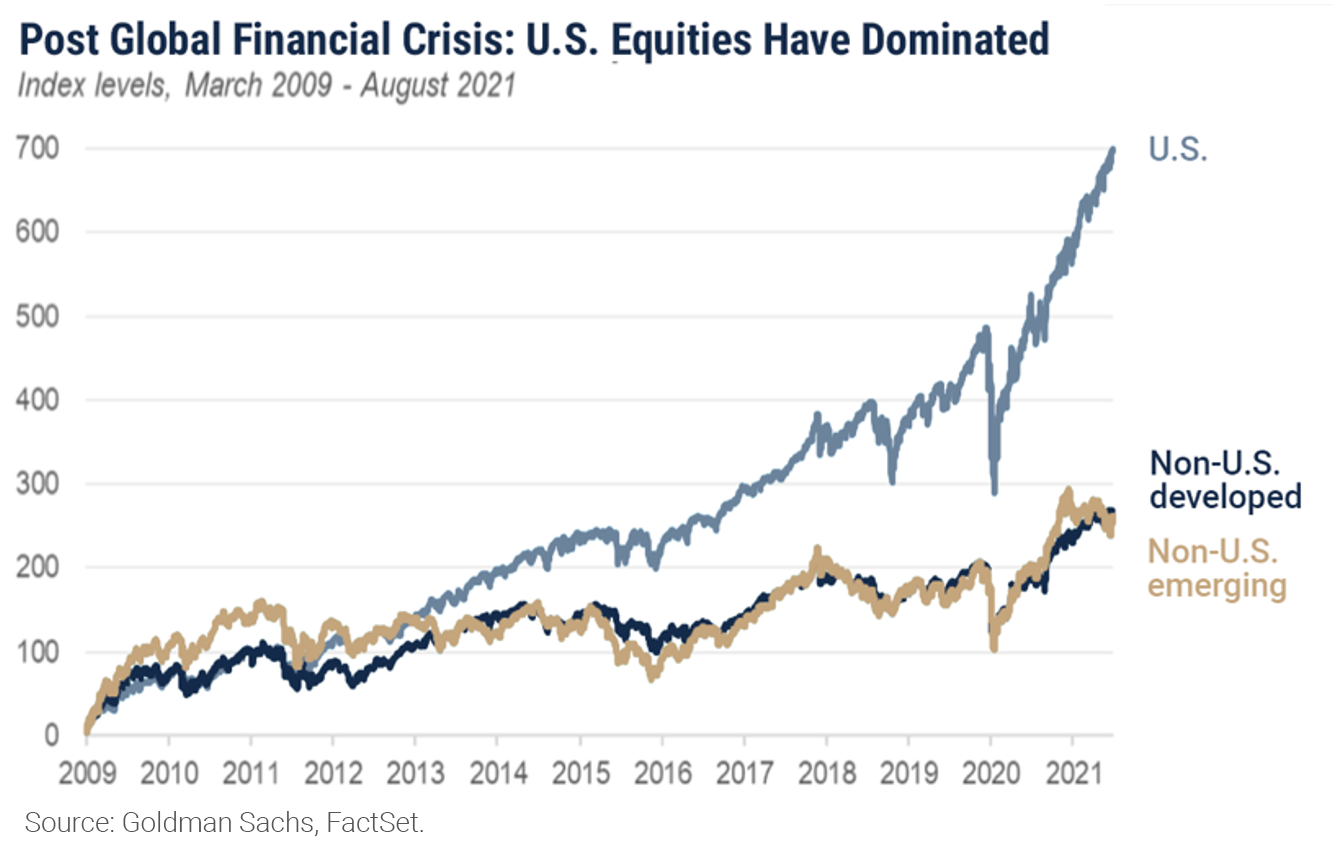
The performance gap since the March 2009 market bottom after the financial crisis has been even more pronounced but this time in favor of U.S. equities, and particularly large cap stocks. The most important driver of relative returns over the past decade was the Fed’s proactive rescue of the American financial system. The Fed’s aggressive and timely response allowed a much quicker domestic recovery than other global economies achieved and reinforced the reputation of the U.S. as a safe haven. As a result, investment allocations have poured into the domestic markets.
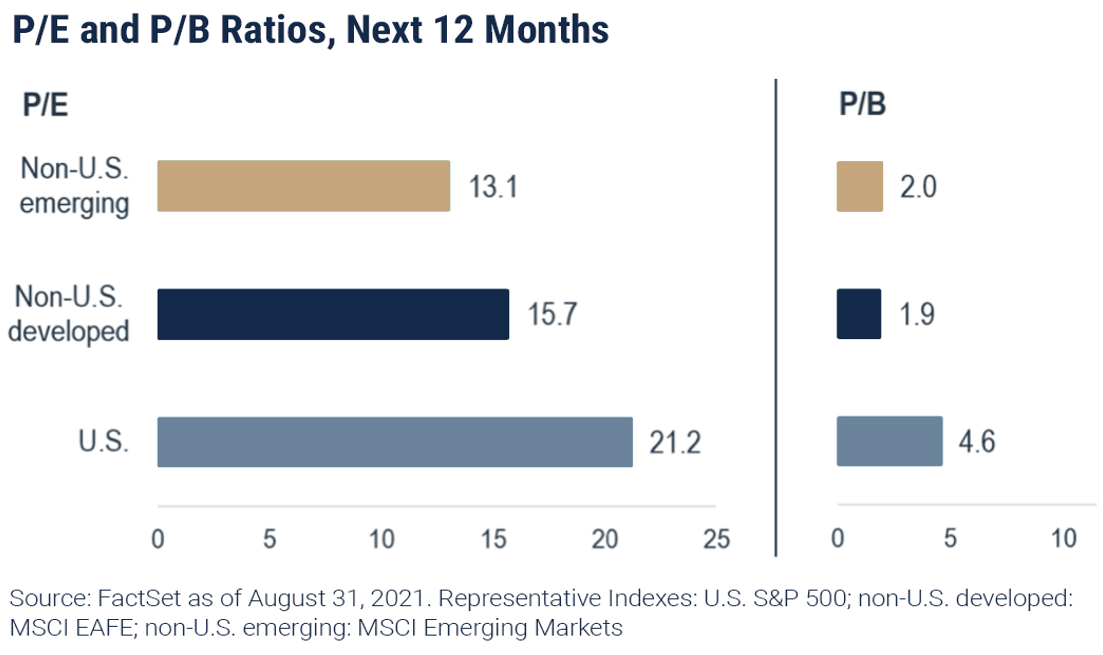
Recognizing the challenges inherent in calling the timing of shifts in long-term trends, we remain committed to our non-U.S. allocations for three main reasons. First and most important is the valuation gap between domestic stocks and their foreign counterparts. Investors have paid increasingly large premiums for the reliability of big, stable U.S. companies, and that sentiment was understandable given the uncertainty surrounding the pandemic. As we have discussed in prior letters many of those companies, particularly in the tech sector, benefited from the pandemic. So, while the outperformance of U.S. equities has a reasonable fundamental basis, it has driven the gap in pricing on U.S. stocks relative to their overseas peers to levels that predict higher prospective returns for both developed and emerging non-U.S. stocks.
The second factor arguing for equity allocations to international stocks is the potential for better economic and earnings growth outside of the U.S. As we mentioned the domestic economy led the world through the financial and COVID crises, and as the business cycle in the U.S. matures the rest of the world remains in recovery mode. Corporate earnings growth is slowing in the U.S. but accelerating in other parts of the world for reasons that range from the recovery in commodity prices to a renewed focus on productivity in foreign economies.
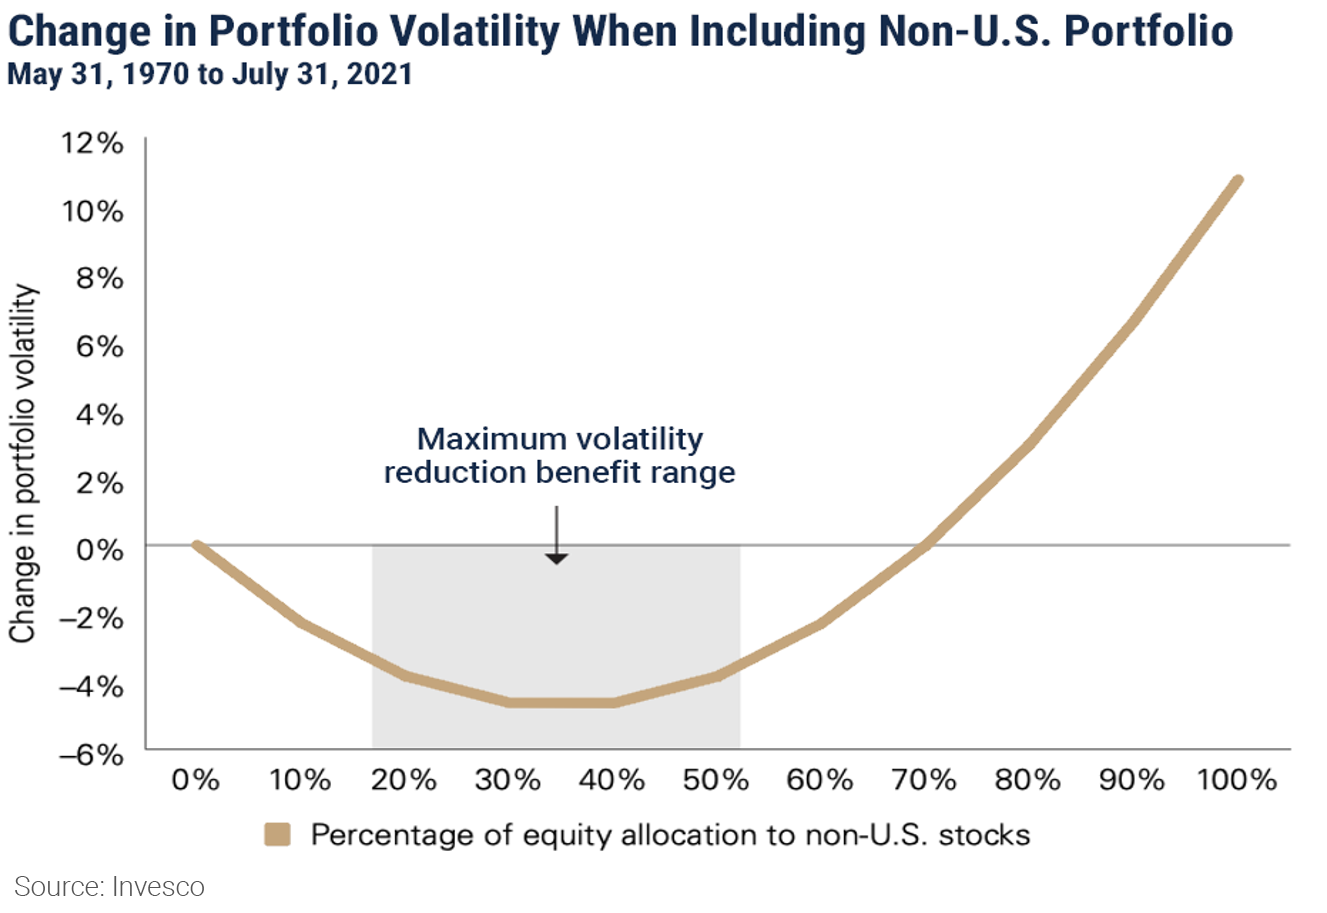
Finally, the perpetually relevant rationale for including non-U.S. stocks in a portfolio is the ageless case for broad diversification. Managing volatility tends to be a forgotten objective during bull markets, but because of the performance rotation between U.S. and international stocks a portfolio including both can be lower risk than an all-U.S. portfolio. Differences in the timing of economic cycles, fiscal and monetary policies, and currency fluctuations all contribute to the diversification benefit gained by the inclusion of international stocks. A recent study by Vanguard demonstrated the maximum volatility reduction benefit occurs in portfolios with 30 to 40% of equities allocated to international stocks.
Bond Market Overview
Bond portfolios were little changed for the quarter with virtually every fixed income asset class finishing up or down less than 1.0%. That remarkably tight performance range belies the volatility seen in late September, which was driven by the same factors impacting the stock market. Most fixed income indices were solidly positive for the quarter through mid-September, and yields declined in the flight to safety following the rise in COVID-19 cases in July and August. That trend changed abruptly in response to the unexpectedly hot inflation data and concerns about the Fed’s path.
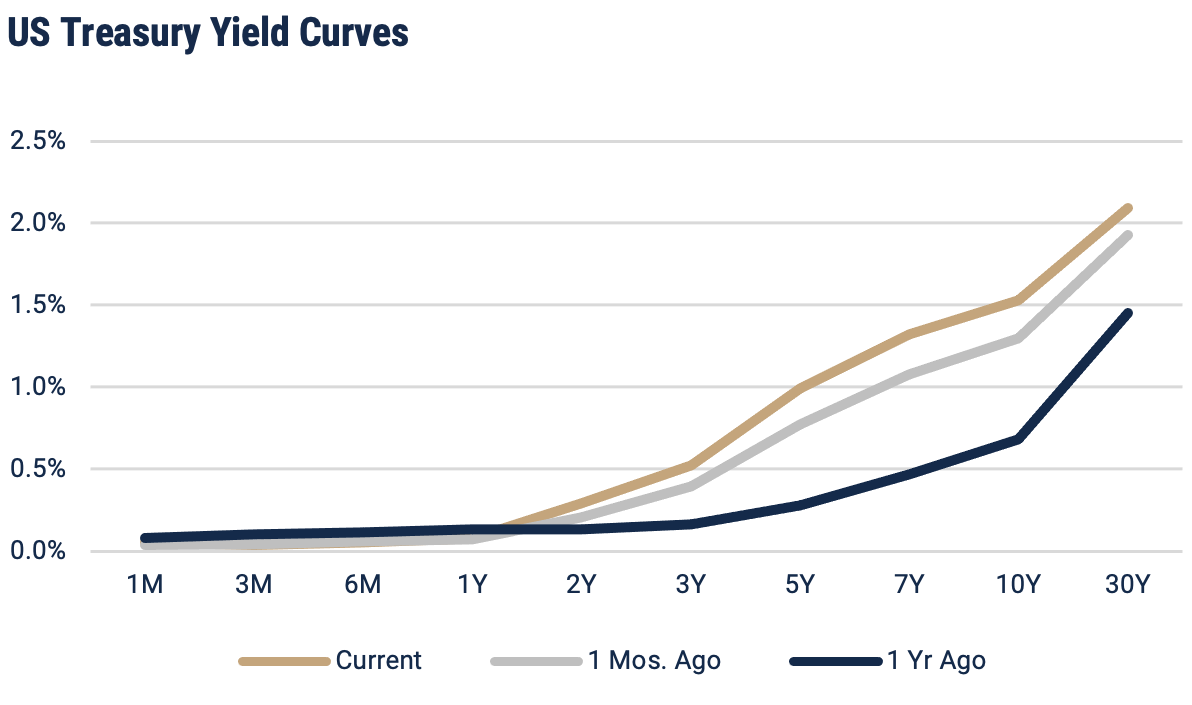
That shift in sentiment around Fed policy weighed heavily on the bond markets during the final week of the quarter, erasing most of the quarter-to-date returns and dragging the year-to-date numbers back to the levels seen at the end of June. Longer duration bonds were affected most. For example, the iShares 20+ Year Treasury Bond ETF fell 5% during the last week of September, bringing its year-to-date return down to negative 7.5% and its one-year return to negative 10.3%. Comparing those numbers with the figures for the iShares 1-3 Year Treasury Bond ETF, which broke even for the week and was essentially flat for the year-to-date and one-year periods, validates our conservative portfolio posturing in bond accounts. With so little extra return to be earned by extending durations we continue to invest fixed income portfolios with an eye toward capital preservation as well as income, and with a longer-term objective of ensuring the portion of portfolios invested in bonds will be available for reinvestment when interest rates eventually rise.
Positioning & Outlook
As we head toward the close of the year with the global economic recovery decelerating and year-to-date market returns still much higher than anticipated in January, we have plenty to think about! In general our balanced portfolio positioning remains growth oriented, but we remain watchful of the many factors outlined in this letter.
The stagflation narrative is ominous, but if the price pressures from today’s supply chain back-ups and high energy costs ease the Fed may be able to buy some additional time before applying tighter policy measures. In that case macroeconomic sentiment will likely improve and the markets can enjoy another healthy run.
Washington politics and fiscal policy shifts to a higher debt/higher tax regime represent another important source of risk to the U.S. economy in coming months. Debt service costs and higher taxes could undermine the huge tailwind of liquidity supporting the recovery now. The details of the plans under consideration now will be important to market sentiment as we enter 2022.
In the relatively near term, the market will learn how the Evergrande story will unwind, with important implications for China, emerging markets in general, and possibly the global economy. Hearing the name “Evergrande” used in the same sentence with “Lehman Brothers” hints at the magnitude of the problems a collapse of that Chinese behemoth could cause. Resolution of that situation will be an important indicator of both of the health of the Chinese economy and the Chinese government’s commitment to the country’s role as an emerging global leader.
Notes & Disclosures
Unless otherwise indicated, performance information for indices, funds and securities as well as various economic data points are sourced from FactSet as of December 31, 2020.
Wilbanks, Smith & Thomas Asset Management (WST) is an investment adviser registered under the Investment Advisers Act of 1940. Registration as an investment adviser does not imply any level of skill or training. The information presented in the material is general in nature and is not designed to address your investment objectives, financial situation, or particular needs. Prior to making any investment decision, you should assess, or seek advice from a professional regarding whether any particular transaction is relevant or appropriate to your individual circumstances. This material is not intended to replace the advice of a qualified tax advisor, attorney, or accountant. Consultation with the appropriate professional should be done before any financial commitments regarding the issues related to the situation are made.
This document is intended for informational purposes only and should not be otherwise disseminated to other third parties. Past performance or results should not be taken as an indication or guarantee of future performance or results, and no representation or warranty, express or implied is made regarding future performance or results. This document does not constitute an offer to sell, or a solicitation of an offer to purchase, any security, future or other financial instrument or product. This material is proprietary and being provided on a confidential basis, and may not be reproduced, transferred, or distributed in any form without prior written permission from WST. WST reserves the right at any time and without notice to change, amend, or cease publication of the information. The information contained herein includes information that has been obtained from third party sources and has not been independently verified. It is made available on an "as is" basis without warranty and does not represent the performance of any specific investment strategy.
Some of the information enclosed may represent opinions of WST and are subject to change from time to time and do not constitute a recommendation to purchase and sale any security nor to engage in any particular investment strategy. The information contained herein has been obtained from sources believed to be reliable but cannot be guaranteed for accuracy.
Besides attributed information, this material is proprietary and may not be reproduced, transferred or distributed in any form without prior written permission from WST. WST reserves the right at any time and without notice to change, amend, or cease publication of the information. This material has been prepared solely for informative purposes. The information contained herein may include information that has been obtained from third party sources and has not been independently verified. It is made available on an “as is” basis without warranty. This document is intended for clients for informational purposes only and should not be otherwise disseminated to other third parties. Past performance or results should not be taken as an indication or guarantee of future performance or results, and no representation or warranty, express or implied is made regarding future performance or results. This document does not constitute an offer to sell, or a solicitation of an offer to purchase, any security, future or other financial instrument or product.