
3Q 2020 Economic & Market Overview
Nothing in life is to be feared, it is only to be understood. Now is the time to understand more so that we may fear less.
- Marie Curie
The future ain’t what is used to be.
- Yogi Berra
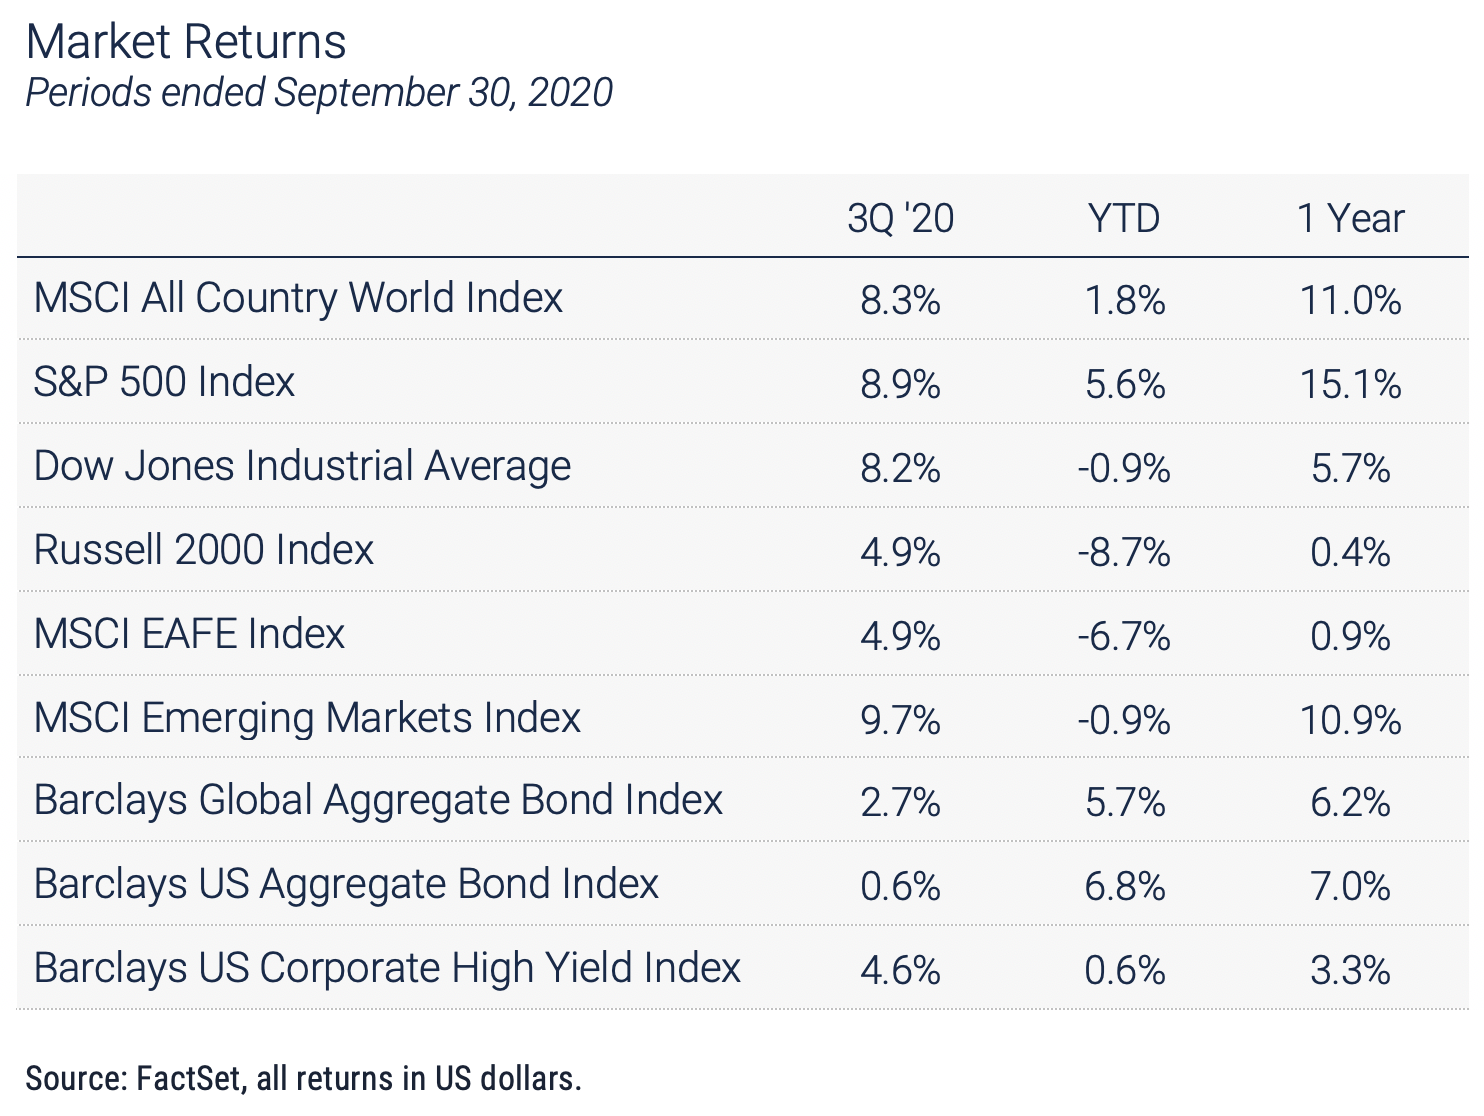
Investors ignored the backdrop of bad news and unease this summer and pushed stocks to new highs, with the MSCI All Country World Index (ACWI) rising 8.3% in the quarter, bringing the year-to-date return back into the green at +1.8%. Looking back over the past 12 months the ACWI is up 11%, as if nothing unusual has happened in the world, despite the gut-wrenching 34% decline from February 19 to March 23. How have investors mustered the courage to keep buying stocks in the face of the challenging economic picture? As we outlined last quarter the answer is simple: liquidity. The support from governments around the world to the Coronavirus shutdown leaves the global economy awash in cash, and with interest rates stuck near all-time lows savers and institutions needing income are being forced to buy risky assets despite their meager yields.
The old saying "Hindsight is 20/20" has taken on new meaning this year, and most of us are ready to see 2020 in the rearview mirror. Since March the COVID-19 pandemic has established a new normal of inconvenience, isolation and fear. Compounding the concerns about the virus over the past several months were a record-setting tropical storm season that hammered the Atlantic and Gulf coasts, unprecedented wildfires in the Western US, and a vitriolic election season that has divided the country along partisan lines. Americans are stressed out and anxious, and from an economic standpoint it's easy to see the root of that anxiety. Over the past nine months, we've been through the fastest contraction in the US economy and the deepest global recession since the 1930s, and the swiftest recovery from a 30% market decline in history. The massive and unprecedented fiscal and monetary responses from governments around the world fueled a strong snapback but raised new concerns about the longer-term implications of burgeoning deficits and national debt. Even after the quick recovery, the economy remains vulnerable. Weekly Initial Claims for Unemployment Insurance in the US have slipped under 1 million after peaking in March at almost 7 million, but the current 8.4% unemployment rate is more than double the 3.5% rate in January. Importantly, the ranks of the newly unemployed include millions of workers in the entertainment, travel and hospitality sectors, which remain moribund. Ultimately there can be no sustainable economic recovery without a solution to the COVID crisis, and despite high hopes for an effective vaccine the broad trends in the pandemic are sending mixed messages as we write this overview.
Investors ignored the backdrop of bad news and unease this summer and pushed stocks to new highs, with the MSCI All Country World Index (ACWI) rising 8.3% in the quarter, bringing the year-to-date return back into the green at +1.8%. Looking back over the past 12 months the ACWI is up 11%, as if nothing unusual has happened in the world, despite the gut-wrenching 34% decline from February 19 to March 23. How have investors mustered the courage to keep buying stocks in the face of the challenging economic picture? As we outlined last quarter the answer is simple: liquidity. The support from governments around the world to the Coronavirus shutdown leaves the global economy awash in cash, and with interest rates stuck near all-time lows savers and institutions needing income are being forced to buy risky assets despite their meager yields.
The most important economic news during the quarter was easy to miss amid the headlines about the pandemic and the social and political unrest. In its August meeting, the Federal Reserve modified its framework for interest rate policy by changing the way its inflation targets operate. The shift from a maximum level to an average inflation level will permit the Fed to leave rates unchanged even if inflation exceeds the current 2% target. This seemingly minor shift is a game-changer because it allows the Fed to keep rates at current levels even if inflation picks up. The Fed's focus now turns to maximizing employment as the economy emerges from the pandemic, and even if inflation ticks above 2% the new Fed policy allows leeway to keep rates low, supporting the recovery. All things being equal that is good news for the equity market.
From an overall portfolio standpoint, the Fed’s shift to its new "lower for even-longer" policy exacerbates the challenges facing income-oriented investors. With virtually no income available from traditional safe havens including money market funds and short-term Treasuries, investors have bought up income-producing assets of all types, pushing up prices, driving down yields, and reducing the margin for error across virtually all asset classes. Expected returns are a key element in the investment planning process for any institution or individual, and as prices have risen expected future returns have declined. The Fed’s move to the lower limit on interest rates and its explicit commitment to keeping rates low has repriced risk to a point at which the upside for most asset classes is limited.
POSITIONING & OUTLOOK
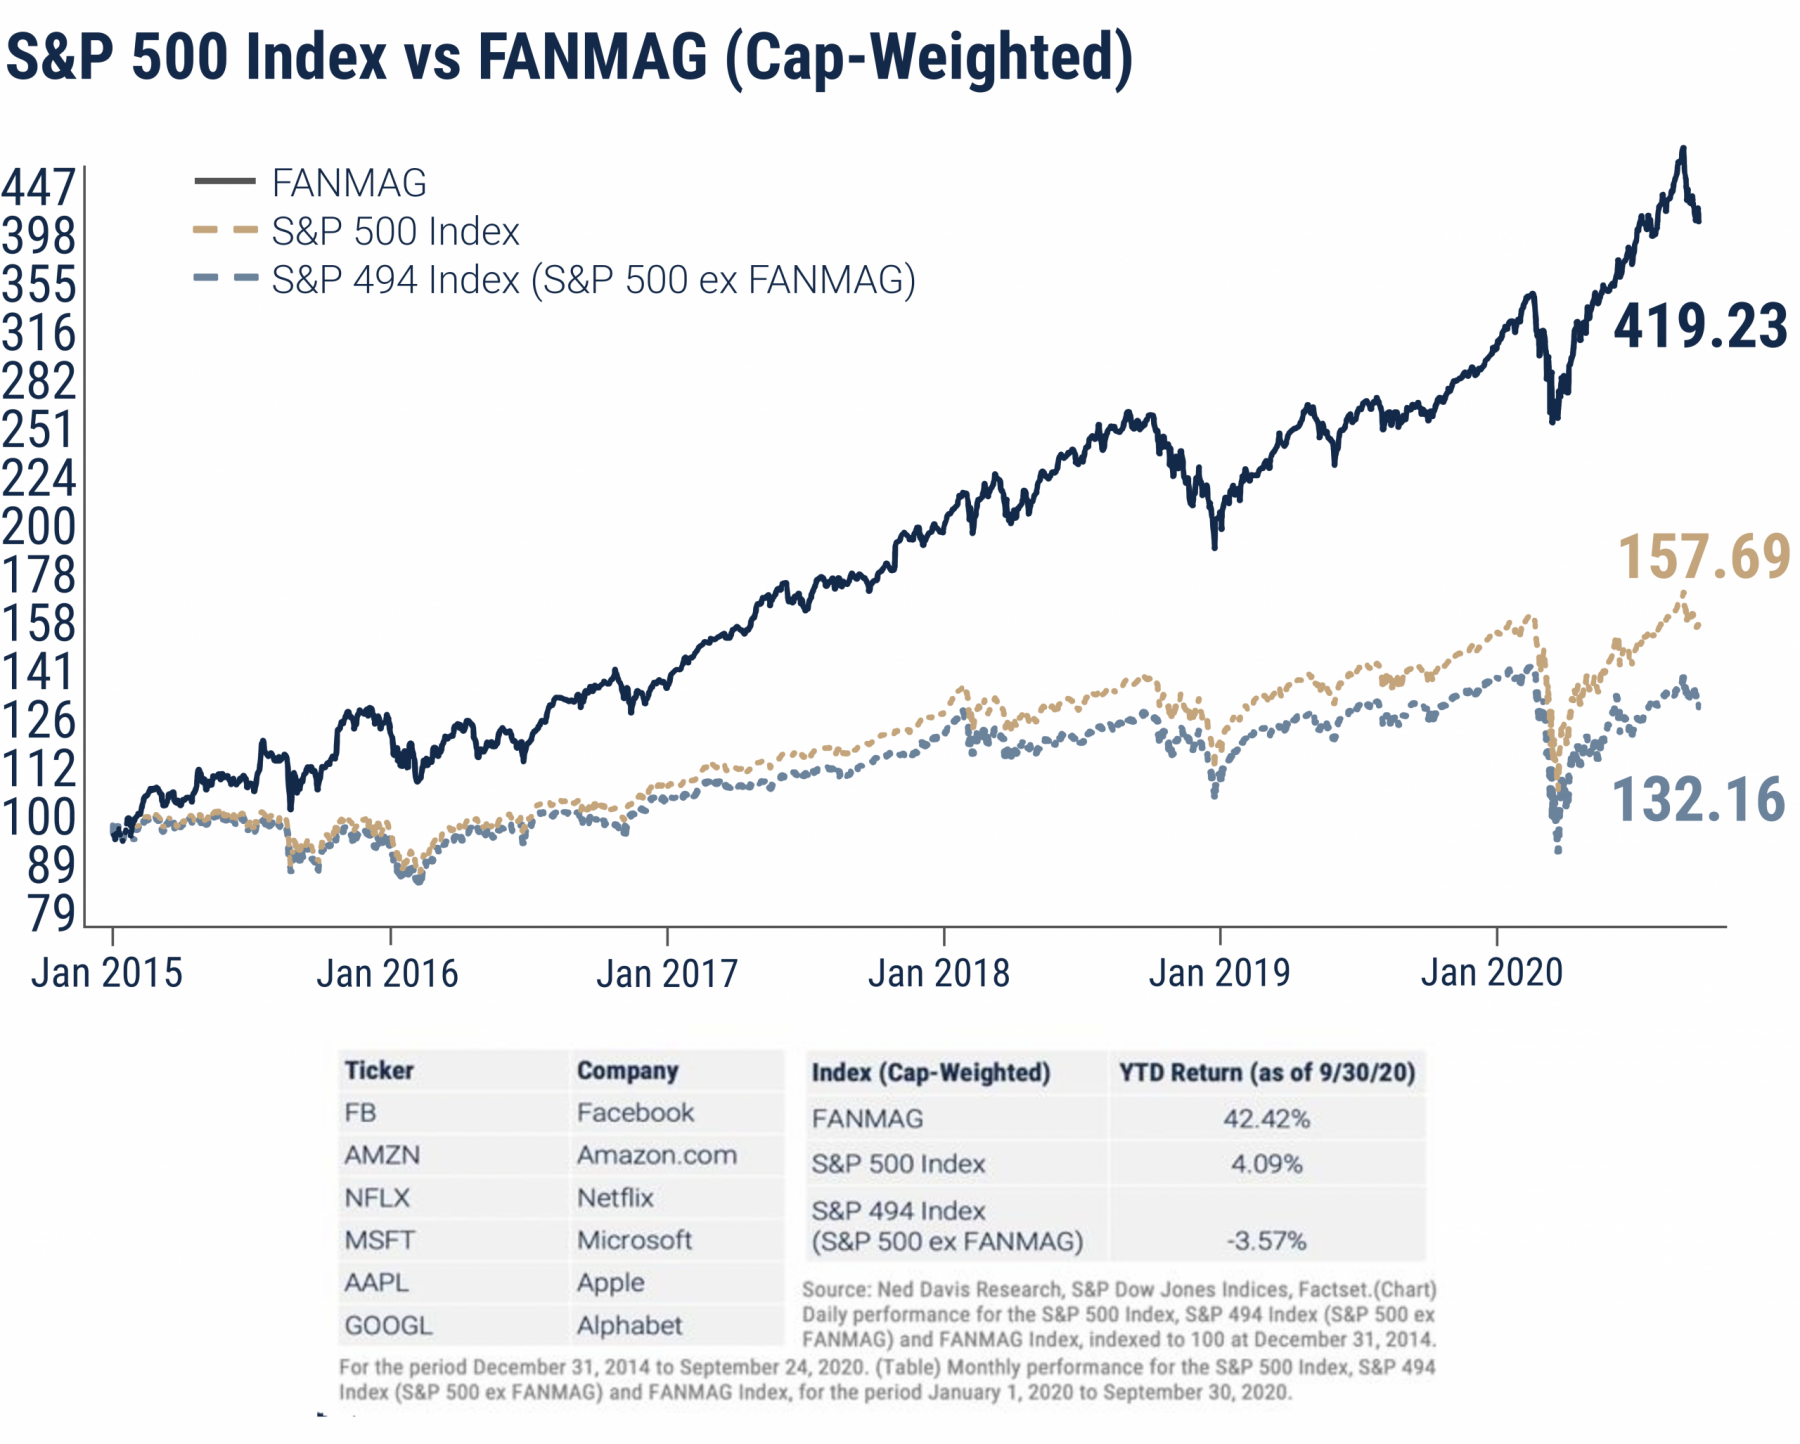
On the heels of the second quarter’s decline and the third quarter’s bounce, the fourth quarter marks the start of a highly uncertain period for the global economy and investors. As we consider our portfolio positioning several factors come into view. We shifted our models in late March and early April in effort to increase portfolio resiliency by reducing our exposure to emerging markets equities and increasing our allocation to certain US stocks as the pandemic progressed. That repositioning was an effort to allow our portfolios to participate in the resurgence of the high-quality, large-cap segment of the market. The weakest segment of the market has been the value category, which has underperformed in the US and abroad across all size categories. As of the end of the third quarter, the gap between large-cap growth and large-cap value indexes for the year to date was over 35%. Digging into those numbers reveals a stunning level of dominance by six companies, recognized by the new acronym “FANMAG.” The six companies, Facebook, Amazon, Netflix, Microsoft, Apple, and Alphabet (Google) are responsible for all of the positive returns in the S&P 500 year-to-date. As the chart below reveals those six companies as a group are up over 40% for the year while the other 494 companies in the index are down almost 4%. The FANMAGs are the obvious beneficiaries of the acceleration and transformation of online social networking, e-commerce, distance learning and telecommuting. We are maintaining our positions in the big six through our holdings in the S&P 500 and other large-cap index funds, but we expect value equities, those companies that are inexpensive relative to their earnings, dividends and growth potential, to have their day in the sun as the global economic recovery grinds forward.
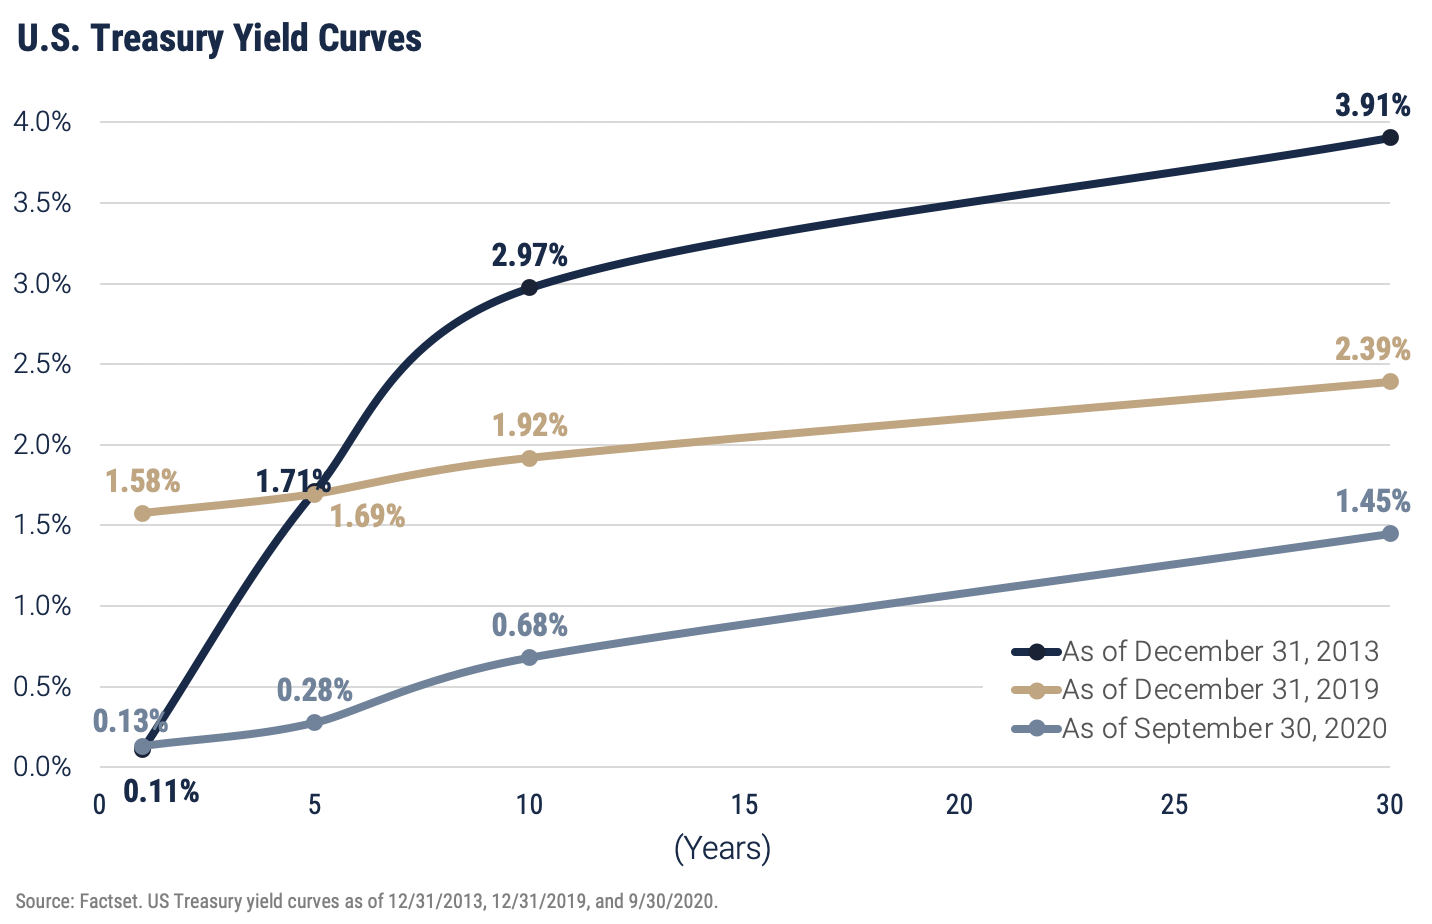
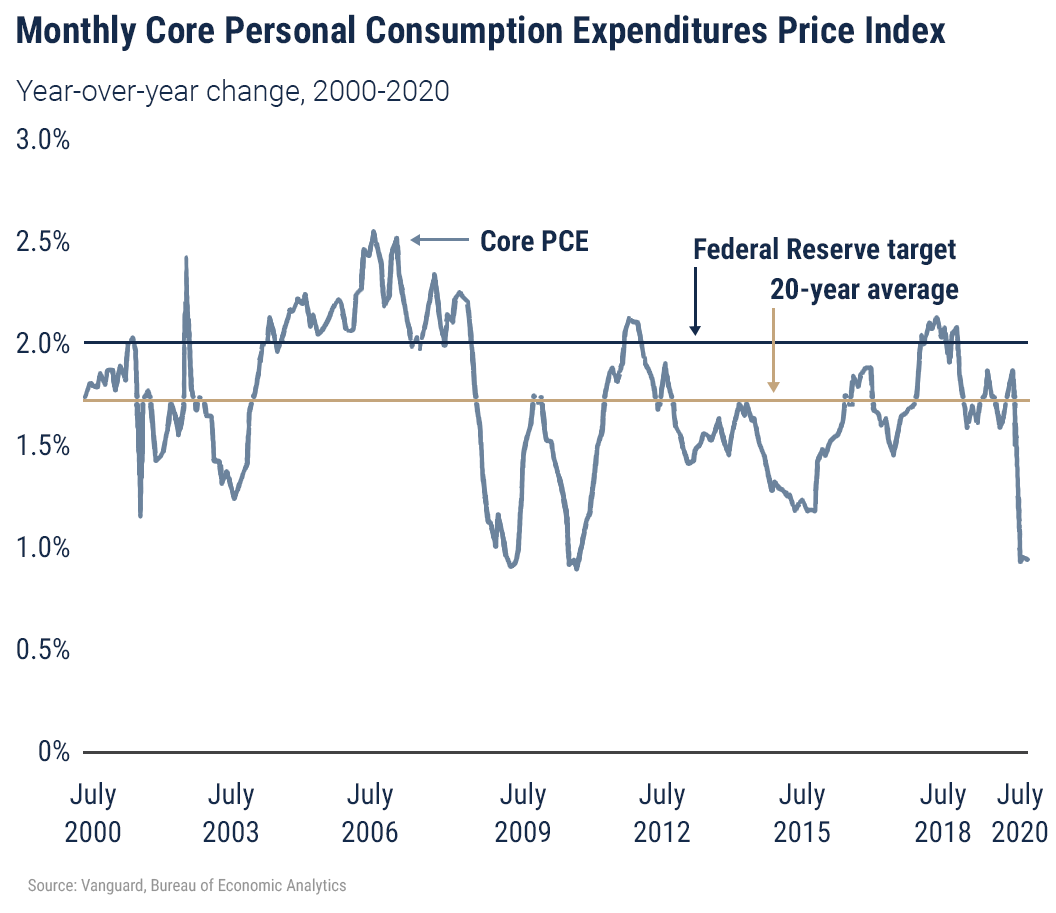
While broad diversification remains sensible within the equity segment of portfolios, the opposite is true in the bond segment. The Fed's new approach to managing inflation changes the landscape and may rewrite the rules for fixed income investing. Average inflation targeting allows the FOMC much more latitude and flexibility in setting rates, which makes the process less predictable. Under the current policy, the Fed has been very careful to avoid surprises by telegraphing moves well in advance and releasing verbatim transcripts of its meetings. By replacing the 2% inflation target with a subjective average range that incorporates employment data, the Fed has added a great deal of uncertainty to the long-term inflation outlook. The graph below depicts the benign inflation environment we’ve enjoyed over the past 20 years, a period in which the average rate of inflation has remained well below the 2% target. Several factors have contributed to that trend, but the Fed’s hands-on approach and willingness to nip inflation in the bud by raising rates proactively has played a key role, especially on the long end of the yield curve where expectations of future inflation are most important.
The new policy framework will likely lead to higher risk premiums on long-dated bonds, which coupled with the new commitment to “lower for longer” short rates means a steeper yield curve. With interest rates throughout the developed world close to zero we are left with two unappealing choices as we construct bond portfolios. The first is to increase the duration of the bonds in the portfolio and the second is to take more credit risk, which means seeking higher income by owning bonds issued by companies rather than the U.S. Treasury. Glancing back at the charts in this report, we can eliminate the first option. Treasury yields at current levels are a bad bet; with the 10-year yield under 0.7%, there is virtually no income available and plenty of downside if rates rise. Consider the impact on the price of a 30-year Treasury bond currently yielding 1.45% if the rate of inflation were to exceed 2%. A 1% increase in the yield on the 30-year bond would reduce the price of that bond by about 25%. The second option, owning corporate bonds, is manageable if executed cautiously. Corporate bonds are reasonably priced and attractive relative to Treasuries, so our primary focus in bond portfolios is short and intermediate maturity, high-quality corporate bonds and funds. By positioning bond portfolios conservatively, we are seeking as much income as possible but focusing primarily on capital preservation.
On a final positive note, CNBC published its 2020 Financial Advisor 100 rankings on October 6th and ranked WST 69th on the list after an initial analysis of a list of 37,369 RIA firms across the country. According to CNBC, “The CNBC FA 100 celebrates those advisory firms that top the list when it comes to offering comprehensive planning and financial services to help clients navigate their financial lives.” We sincerely appreciate the client relationships and strategic partnerships that have enabled our growth and positioned the firm for recognition by CNBC. For more information as to the rankings and criteria visit here: https://www.cnbc.com/2020/10/06/heres-how-we-determine-the-fa-100-list.html.
Important Disclosures
Unless otherwise indicated, performance information for indices, funds and securities as well as various economic data points are sourced from FactSet as of September 30, 2020.
Wilbanks, Smith & Thomas Asset Management (WST) is an investment adviser registered under the Investment Advisers Act of 1940. Registration as an investment adviser does not imply any level of skill or training. The information presented in the material is general in nature and is not designed to address your investment objectives, financial situation or particular needs. Prior to making any investment decision, you should assess, or seek advice from a professional regarding whether any particular transaction is relevant or appropriate to your individual circumstances. This material is not intended to replace the advice of a qualified tax advisor, attorney, or accountant. Consultation with the appropriate professional should be done before any financial commitments regarding the issues related to the situation are made.
This document is intended for informational purposes only and should not be otherwise disseminated to other third parties. Past performance or results should not be taken as an indication or guarantee of future performance or results, and no representation or warranty, express or implied is made regarding future performance or results. This document does not constitute an offer to sell, or a solicitation of an offer to purchase, any security, future or other financial instrument or product. This material is proprietary and being provided on a confidential basis, and may not be reproduced, transferred or distributed in any form without prior written permission from WST. WST reserves the right at any time and without notice to change, amend, or cease publication of the information. The information contained herein includes information that has been obtained from third party sources and has not been independently verified. It is made available on an "as is" basis without warranty and does not represent the performance of any specific investment strategy.
Some of the information enclosed may represent opinions of WST and are subject to change from time to time and do not constitute a recommendation to purchase and sale any security nor to engage in any particular investment strategy. The information contained herein has been obtained from sources believed to be reliable but cannot be guaranteed for accuracy.
Besides attributed information, this material is proprietary and may not be reproduced, transferred or distributed in any form without prior written permission from WST. WST reserves the right at any time and without notice to change, amend, or cease publication of the information. This material has been prepared solely for informative purposes. The information contained herein may include information that has been obtained from third party sources and has not been independently verified. It is made available on an “as is” basis without warranty. This document is intended for clients for informational purposes only and should not be otherwise disseminated to other third parties. Past performance or results should not be taken as an indication or guarantee of future performance or results, and no representation or warranty, express or implied is made regarding future performance or results. This document does not constitute an offer to sell, or a solicitation of an offer to purchase, any security, future or other financial instrument or product.