
2Q 2023 | Economic & Markets Review
“You have to work hard to make it simple.” - Steve Jobs
"Cash combined with courage in a time of crisis is priceless." -Warren Buffett
The evolving macroeconomic picture gave investors plenty to think about during the second quarter, but the rally in global stocks continued with MSCI All Country World Index closing up 14.3% and the S&P 500 up 16.9% for the first half of the year.
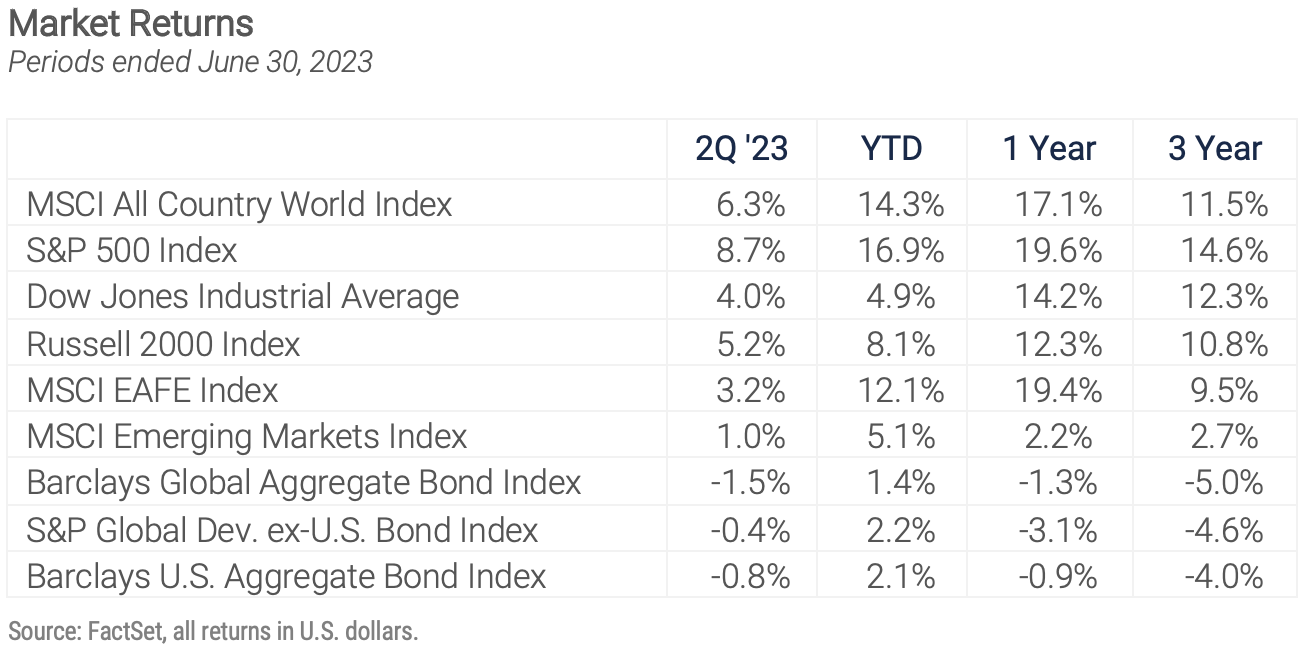
The foundation for that strong performance was unexpectedly resilient economic growth which forestalled a much-feared earnings recession despite concerted efforts by global central banks to head off inflation. The durable U.S. labor market continues to support consumption, but the strength of the labor market is a double-edged sword as worker shortages are one of the inflationary pressures with which the Fed is contending.
Central bankers and investors spent the quarter parsing data and seeking visibility on how the inflation picture will unfold. Along with labor shortages the global economy is wrestling with the unsettled geopolitical situation, which impacts energy markets and makes supply chains less efficient, the ongoing supply/demand imbalance in the U.S. housing market, and the inflationary impact of the ongoing transition to renewable sources of energy. Since March the markets have come around to the view that central banks and the Fed in particular will be slow to ease policy until these inflationary pressures are better understood. While the Fed ended its 10-meeting streak of rate hikes in June, leaving the benchmark fed funds rate target at 5%-5.25%, its ensuing commentary was surprisingly hawkish. Fed officials stated clearly the June pause was an effort to allow the FOMC time to assess the longer-term impact of the record-setting series of rate hikes already in place, an important topic given the significant lag normally observed between shifts in Fed policy and changes in economic performance. The consensus among the Fed officials at the June meeting called for two more rate increases this year, while even one more would take the policy rate to a 22-year high.
It is worth reminding ourselves that as late as November 2021 the Fed was firm in its conviction that the inflationary pressures created by its policy during COVID would prove transitory, so basing portfolio decisions on Fed guidance is perilous.
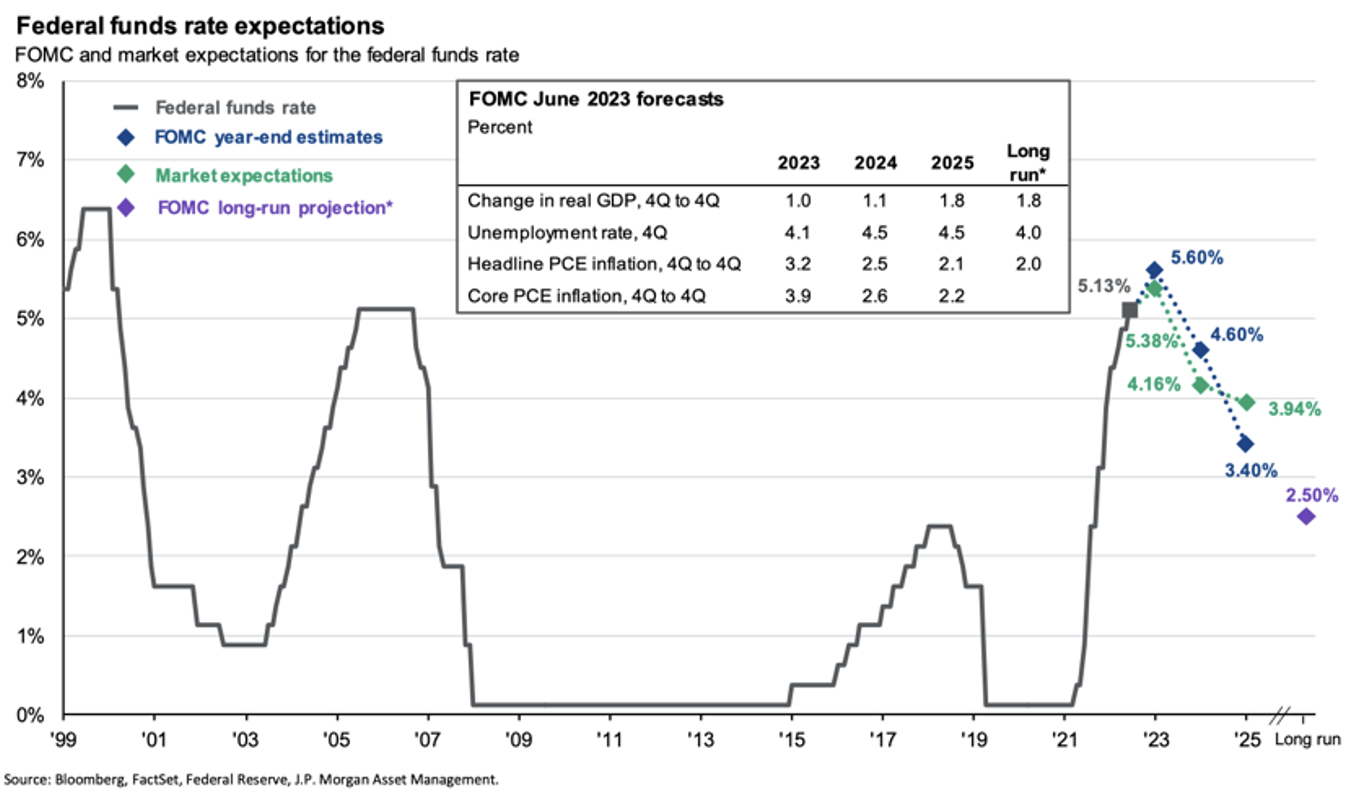
In the past two commentaries, we have addressed the gap between Fed guidance as expressed by the dot plot, and market expectations for interest rates as expressed by the bond market. That gap closed in June after the Fed’s forecasts for the fed funds rate rose to 5.6% at the end of 2023 and 4.6% at the end of 2024, up from March’s forecasts of 5.1% and 4.3%, respectively. Rising short-term yields reflect the market’s realization the Fed has more work to do as it seeks to bring inflation in line with its 2% long-term target, and the steeply inverted yield curve suggests the market remains confident in the central bank's ability to succeed in that mission over a relatively short time frame.
We recognize the possibility the market is too optimistic about the timing of future rate cuts as implied by the yield curve, and expect some economic weakness in the months ahead, even if a hard landing is avoided. Core inflation, which excludes food and energy prices, should continue to fall through the end of the year, but it will almost certainly require at least a shallow recession to create enough slack in the labor market to alleviate wage pressures, allowing the Fed to achieve that 2% inflation target. Despite the moderating price increases this year the annualized inflation rate in May was 4%, double the Fed target. Stubborn inflation and a determined Fed create an unfriendly backdrop for broad asset class returns, notwithstanding the strong second quarter performance. The impact on the markets of the next recession, when it comes, will be determined by its effect on corporate profits. Companies could weather a soft, shallow downturn with cost-cutting and efficiency improvements, but a deep profit decline driven by a more severe recession would be especially challenging for the markets now given today’s relatively high valuations.
EQUITY MARKET OVERVIEW
Global stocks outperformed all expectations in the second quarter and first half of 2023 as better-than-anticipated economic news led to improved investor sentiment, even as the longer-term outlook remained murky. June was a strong month for the markets, defying the dictum which advises “sell in May and go away,” as the healthy May payroll numbers offset the hawkish Fed commentary and rising interest rates and raised hopes for an economic soft landing. The S&P 500 Index rose 6.6% in June and 8.7% for the quarter. The improving sentiment about the economy was reflected in strong outperformance by cyclical sectors. While all eleven market sectors enjoyed positive returns in June, cyclical industry groups outperformed non-cyclical groups by a wide margin.
Small and mid-cap stocks are generally assumed to be particularly sensitive to short-term economic trends and benefitted from the June pickup. The S&P 600 Small-Cap index rose 8.2% during the month and the S&P Mid-Cap 400 index rose 9.2%, bringing both indexes into positive territory for the quarter, but leaving both well behind the large-cap benchmarks for the year to date. As we discuss momentarily, we see an opportunity for small stocks, given the recent performance differential.
By far the strongest performing segment of the market this year is the one almost no one picked to lead in 2023 after its huge losses in 2022, the NASDAQ 100 Index. This technology-heavy index is dominated by seven companies, Microsoft, Apple, Nvidia, Alphabet, Amazon, Tesla, and Meta, which make up 55% of the index by market cap and had an average year-to-date return of almost 90% through the end of June. They contributed 77% of the NASDAQ 100 and 73% of the S&P 500 return in the first half. Those companies and others in the tech sector have been driven this year by the expectations around artificial intelligence and machine learning, which could drive huge revenue and profit growth for properly positioned companies.
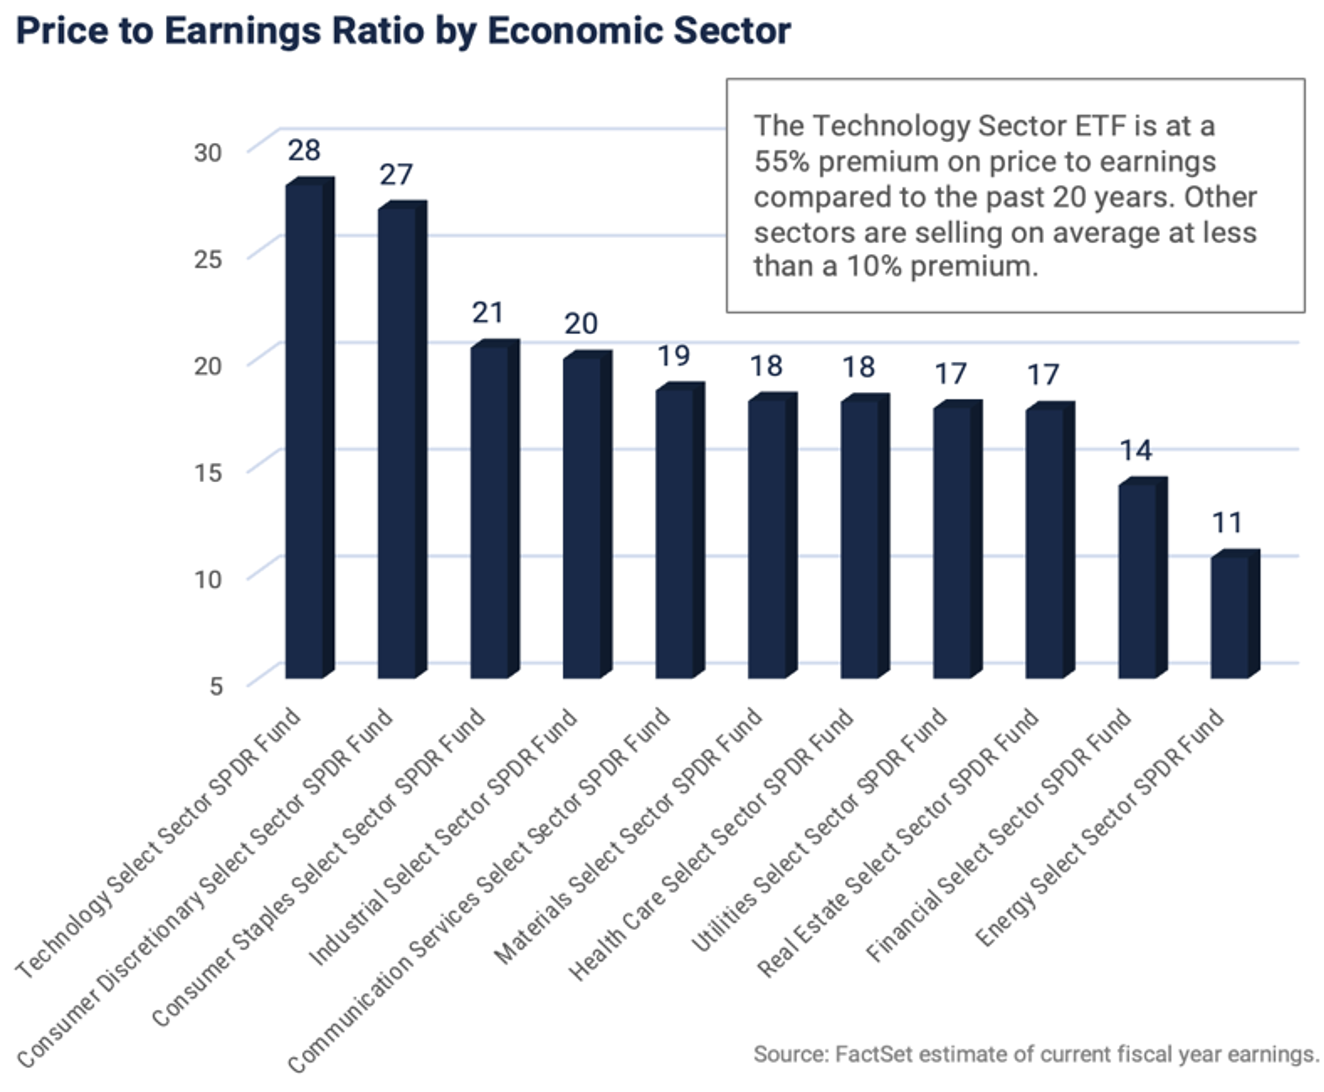
U.S. large cap stocks remain the core of our equity portfolios, but given the huge surge in those large-cap growth stocks this year other segments of the market are relatively more compelling now. With strong performance and high expectations come high valuations. The combined market capitalization of the 100 companies in the NASDAQ 100 index is now over eight times that of the entire Russell 2000 index of small-cap stocks, a ratio last seen during the Internet bubble. As the chart on the left reveals the tech sector is the most expensive of the eleven market sectors and now trades at a 55% premium to its average valuation over the past 20 years.
Yardeni Research pegs the forward P/E ratio of the S&P 500 at 19.1 at the end of the second quarter versus 13.4 for the S&P 600 Small-Cap index, the biggest valuation gap between those indexes since the Internet bubble in 2001. By late 2002 the forward multiples of the two benchmarks had equalized after large-cap growth stocks collapsed. We are not predicting a market collapse, but in general, less expensive stocks have better downside protection in declining markets.
We also continue to believe an allocation to stocks outside the U.S. is prudent, despite the recent outperformance of domestic growth stocks. As of the end of June, U.S. equities represented 60% of the global stock market as measured by market capitalization, up from 40% 15 years ago and out of proportion to the 25% share of global economic activity U.S. GDP represents. According to Morningstar, over the 15 year stretch ending in June, the U.S. market index of large-, mid-, and small-cap stocks has quadrupled in value while the Global ex-US index, which includes both developed and emerging markets, has not even doubled. Historical perspective is important. The first 10 years of the 21st century are referred to as the "lost decade" for U.S. investors because an investment in the broad U.S. equity market at the beginning of 2000 was worth less 10 years later. Non-U.S. and particularly emerging market stocks enjoyed healthy returns during that decade. Today, foreign stocks are priced at undemanding valuations and stand to benefit from even a modest uptick in sentiment.
BOND MARKET OVERVIEW
Sticky inflation and surprisingly strong economic data led to rising interest rates and negative returns for most segments of the bond market in the second quarter. Yield increases were most pronounced in the short end of the curve, where security prices are least affected by higher rates, so the price declines were nominal. The iShares 1-3 Year Treasury Bond ETF declined 0.6% for the quarter, the iShares 3-7 Year Treasury Bond ETF was down 1.5% for the quarter and the iShares 20+ Year Treasury Bond ETF fell 2.5%. More broadly, the Barclays U.S. Aggregate Bond Index was down just under 1%. The only segments of the bond market to generate positive returns during the quarter were those most sensitive to economic activity, and the SPDR Barclays High Yield Bond ETF rose just under 1% and the Powershares Senior Loan ETF (which holds mostly floating rate bank debt) rose 3.5% for the quarter. These returns are consistent with the equity returns discussed earlier, where the most economically sensitive sectors benefited the most.
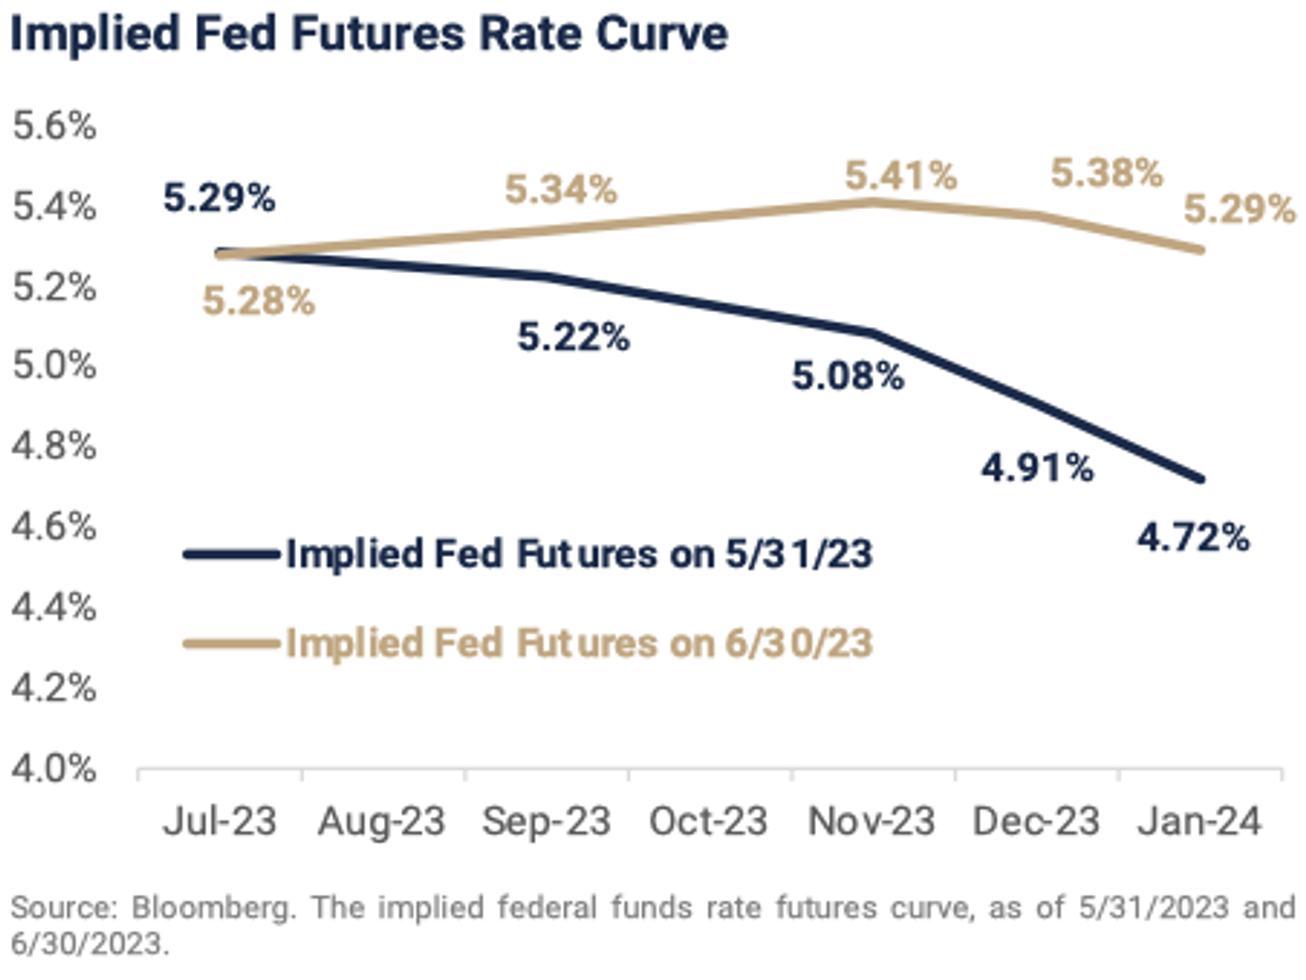
The following graph depicts the big change in market expectations for short-term interest rates in June after the May employment report was released. On May 31, the market was pricing in an expected fed funds rate of 4.72% in January 2024. Based upon the stronger-than-expected economic data and the realization the Fed will indeed need to maintain rates at current levels at least through the end of this year, that rate jumped to 5.29%, at the end of June. The current curve prices in a roughly 50% chance of one more rate hike this year, a development we see as very likely, and as we predicted in last quarter’s commentary, a Fed rate cut is off the table for 2023, barring a major change in the outlook.
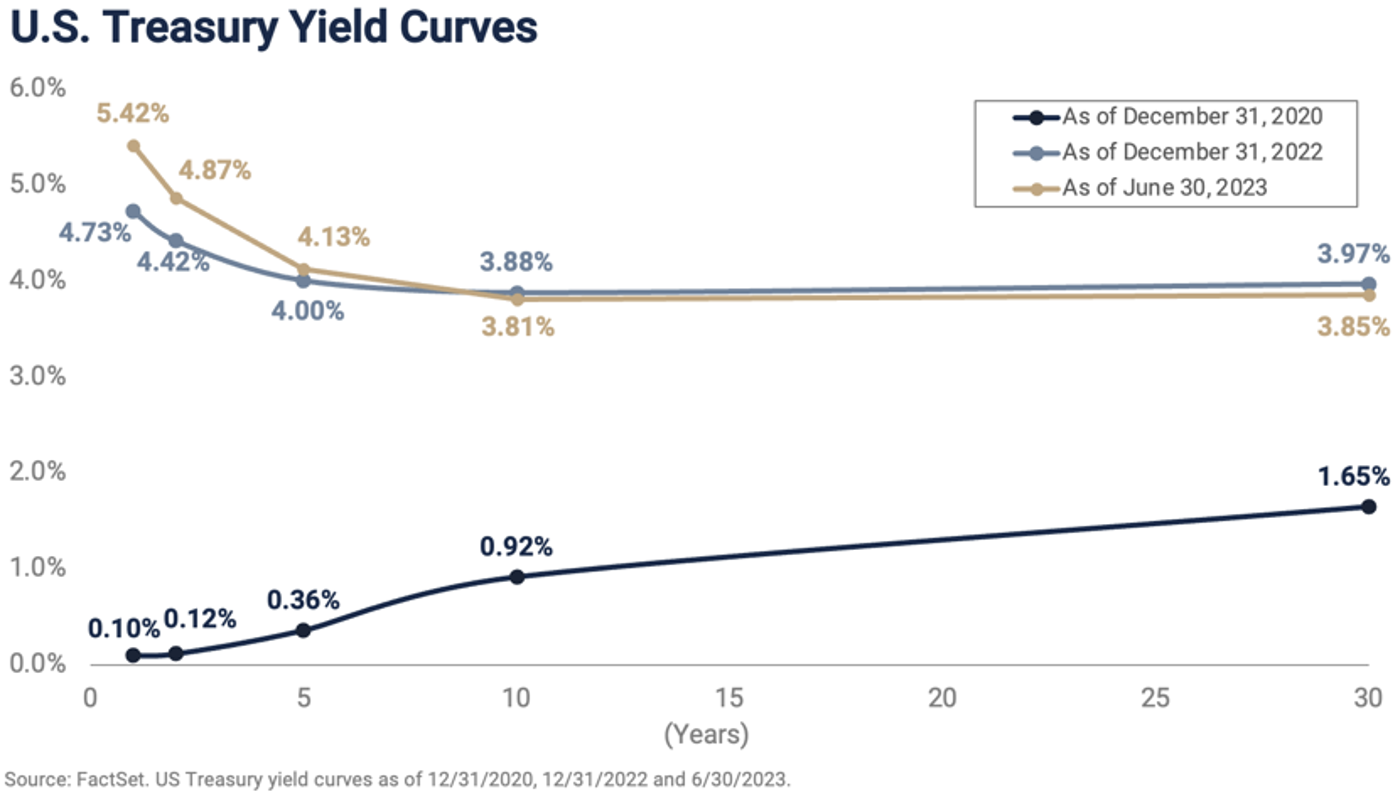
While the Fed Futures Rate curve captures expectations about FOMC decisions on short term interest rates, the U.S. Treasury yield curve as a whole reveals market expectations for all maturities. Yields across the board responded as expected during the quarter, given the recent economic data. Interest rates on the short end of the curve have risen this year, in line with the Fed’s evolving campaign, while rates from 10 years out have actually declined a bit. As a result, the curve is even more steeply inverted now than it was in January, but the story it tells remains the same. The market expects the Fed to continue its aggressive fight against inflation and expects that effort to result in enough economic softness to allow longer-term rates to drift back to the sub-4% level. We remain wary that the market may be too confident in the Fed’s ability to slow the economy enough to dampen inflation without triggering a recession, and then cut policy rates as quickly as the yield curve is implying.
The good news is that rising yields on cash and short-term Treasuries have created interesting and compelling opportunities for us to increase yield and mitigate risk as we structure fixed income portfolios. As we write this commentary the yield on a one year Treasury note is 5.4%, and a two year note pays 5%. A-rated corporate bonds in the one-to-two year maturity range are paying over 6% in some cases. These short-term yields offer good value versus longer-term bonds on both an absolute and risk-adjusted basis. Ultimately the shape of the yield curve will normalize, and we expect that process to involve lower short-term rates but also very likely higher long-term rates that reflect the new inflation regime. For now we are very comfortable accepting the yields available on short duration bonds which offer strong income and protection of capital.
SUMMARY
As we look forward to the second half of 2023 and beyond we reflect upon the need to balance our belief in the importance of maintaining a consistent investment strategy with our awareness of the big shifts underway in the global economy and markets.
Most importantly, 2022 marked the end of the 15 year experiment with low and negative interest rates that began with the Fed’s massive intervention after the Great Financial Crisis and ended with the post-COVID inflation surge taking center stage now. The new interest rate regime has huge implications for the global economy and markets. The increase in debt service costs for families, companies, and indebted nations (think U.S!) will force changes just now beginning to emerge, and the ability of the global economy to absorb higher financing costs while continuing to expand will be tested in coming years.
For investors, today’s higher yields signal a new era for asset allocation, one where we can earn a reasonable return in the low-risk segment of portfolios. Safe yields are now close enough to the expected return on stocks to provide a viable alternative to equities on a risk-adjusted basis, particularly given the economic uncertainties outlined above. For years meager yields supported equities through the “TINA” trade, the concept that "There Is No Alternative" to stocks for investors seeking returns. With money market funds paying over 4% and short-term, high-quality bonds paying 5-6%, the “TINA” trade is dead!
For stock investors recency bias, the inclination to extrapolate recent trends into the future, could lead to the conclusion big U.S. technology companies are trees that will grow to the sky. We think it’s likely the value of diversification will reemerge in coming years, with recently out-of-favor segments of the market including international, value, and small cap stocks contributing meaningfully to portfolio returns.
Given the pace of change and the uncertainty we’ve discussed, we’ll close by reiterating the most important consideration for us at all times, our commitment to building plans and portfolios that allow our clients to achieve their financial goals.
Wilbanks, Smith & Thomas Asset Management (WST) is an investment adviser registered under the Investment Advisers Act of 1940. Registration as an investment adviser does not imply any level of skill or training. The information presented in the material is general in nature and is not designed to address your investment objectives, financial situation, or particular needs. Prior to making any investment decision, you should assess, or seek advice from a professional regarding whether any particular transaction is relevant or appropriate to your individual circumstances. This material is not intended to replace the advice of a qualified tax advisor, attorney, or accountant. Consultation with the appropriate professional should be done before any financial commitments regarding the issues related to the situation are made.
This document is intended for informational purposes only and should not be otherwise disseminated to other third parties. Past performance or results should not be taken as an indication or guarantee of future performance or results, and no representation or warranty, express or implied is made regarding future performance or results. This document does not constitute an offer to sell, or a solicitation of an offer to purchase, any security, future or other financial instrument or product. This material is proprietary and being provided on a confidential basis, and may not be reproduced, transferred, or distributed in any form without prior written permission from WST. WST reserves the right at any time and without notice to change, amend, or cease publication of the information. The information contained herein includes information that has been obtained from third party sources and has not been independently verified. It is made available on an "as is" basis without warranty and does not represent the performance of any specific investment strategy.
Some of the information enclosed may represent opinions of WST and are subject to change from time to time and do not constitute a recommendation to purchase and sale any security nor to engage in any particular investment strategy. The information contained herein has been obtained from sources believed to be reliable but cannot be guaranteed for accuracy.
Besides attributed information, this material is proprietary and may not be reproduced, transferred or distributed in any form without prior written permission from WST. WST reserves the right at any time and without notice to change, amend, or cease publication of the information. This material has been prepared solely for informative purposes. The information contained herein may include information that has been obtained from third party sources and has not been independently verified. It is made available on an “as is” basis without warranty. This document is intended for clients for informational purposes only and should not be otherwise disseminated to other third parties. Past performance or results should not be taken as an indication or guarantee of future performance or results, and no representation or warranty, express or implied is made regarding future performance or results. This document does not constitute an offer to sell, or a solicitation of an offer to purchase, any security, future or other financial instrument or product.