2Q 2022 | Markets & Economic Overview
“Fear is only as deep as the mind allows.” -Japanese proverb
“We don’t have to be smarter than the rest, we just have to be more disciplined than the rest.” -Warren Buffett
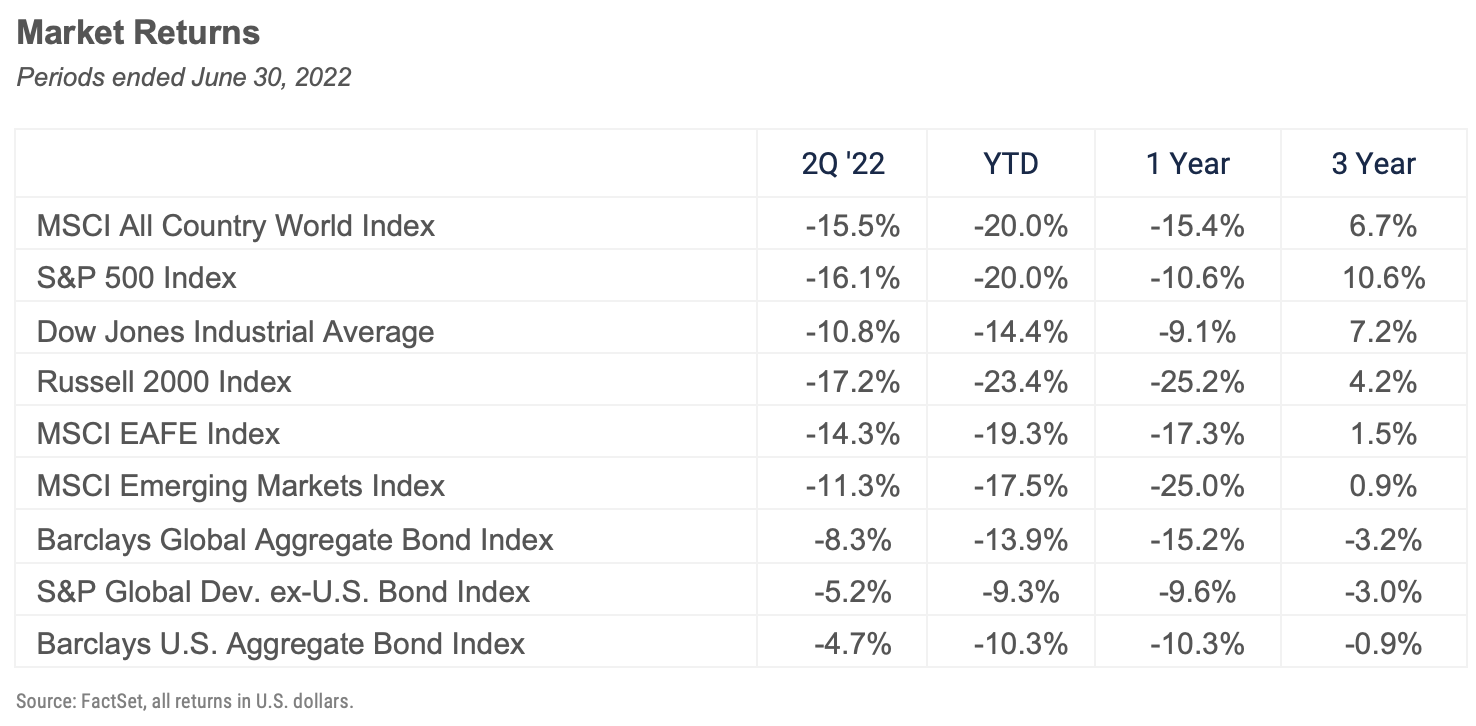
The headwinds facing investors strengthened last quarter leading to lots of "worst since" and "worst ever" comparisons for a broad range of asset classes for the first half of 2022. The S&P 500 stock index was down 16.1% for the quarter and 20.6% for the first half, the worst start to a year since 1970. The Barclays U.S. Aggregate Bond Index fell 4.7% for the quarter and 10.3% for the year-to-date, performance that Deutsche Bank estimates is the worst six months for the bond market since 1788! To make matters worse these declines broke the traditional relationship between bonds and stocks, where bonds are expected to go up in price when stocks fall and vice versa, so diversification seemingly provided no benefit. Consequently, pundits have declared “the death of the 60%/40% portfolio” the classic benchmark for an investment strategy designed to pursue moderate growth. To paraphrase Mark Twain, we believe the reports of that death are greatly exaggerated. In fact, it’s at moments like this that a disciplined, methodical, unemotional, balanced approach to investing is most important. We will return to that topic later in the letter.
The massive pandemic-era support provided by fiscal and monetary policymakers saved the global economy in 2019 and 2020 but ignited a burst of inflation after decades of benign price increases, and that stubbornly high inflation is the most challenging issue facing investors now. It’s forcing central bankers at the Federal Reserve to tighten monetary policy by raising interest rates and shrinking its balance sheet just as the economy slows. The Fed’s stated objective is to increase unemployment just enough to engineer a "soft landing" for the economy, but the risk of an overshoot is high. Investor concern is well-founded. Fed Chairman Powell has stated clearly that he is more concerned with the need to quell inflation than he is about the risk of raising rates too far, too fast and tipping the economy into a recession. Unfortunately, this bout of inflation is driven largely by supply-side forces not easily influenced by central-bank policy. In general, monetary policy is used to dampen inflation by reducing demand for goods and services; higher interest rates mean consumers and businesses have less purchasing power, and less demand for goods and services generally means lower prices. However, if higher prices are driven by lower inventory and less availability of goods and services (supply driven inflation) those prices are less susceptible to policy control.
This is exactly the dynamic in the energy, food, and other commodity markets this year, and it helps explain the drop in consumer confidence in June. Families’ inflation perceptions are driven by the prices of fuel, groceries, and power, all of which are up double-digit percentages this year. As a result, consumer confidence, while still relatively strong, dropped in June to the lowest level in more than a year. More concerning is the decline in the index of consumer expectations, which fell to the lowest level in nearly a decade as Americans lost confidence in the outlook for the economy, labor market, and wages. The gap between consumer confidence and consumer expectations increases the risk of recession because families’ pessimism about their future financial health curtails their current spending and consumption.
Along with the direct headwinds outlined above investors are also dealing with some complicated crosswinds. While the pandemic phase of COVID-19 seems to have passed the possibility of new variants and the challenges of managing COVID-19 as an endemic disease remain. Geopolitical issues including Russia's invasion of Ukraine and concern about China's theft of intellectual property have exacerbated the trend of "de-globalization," undoing decades of progress on international trade and creating cost friction across the commodity complex and the global supply chain.
So, as we look ahead at the second half of the year and beyond, we see plenty of risks but also plenty of opportunity. As we will discuss below our focus is on maintaining discipline and keeping client portfolios in line with long-term objectives amid short-term uncertainty and volatility.
EQUITY MARKET OVERVIEW
Despite positive returns in May and a brief rally in late June, stocks across all sectors, sizes and geographies suffered in the second quarter, culminating a forgettable start to the year.
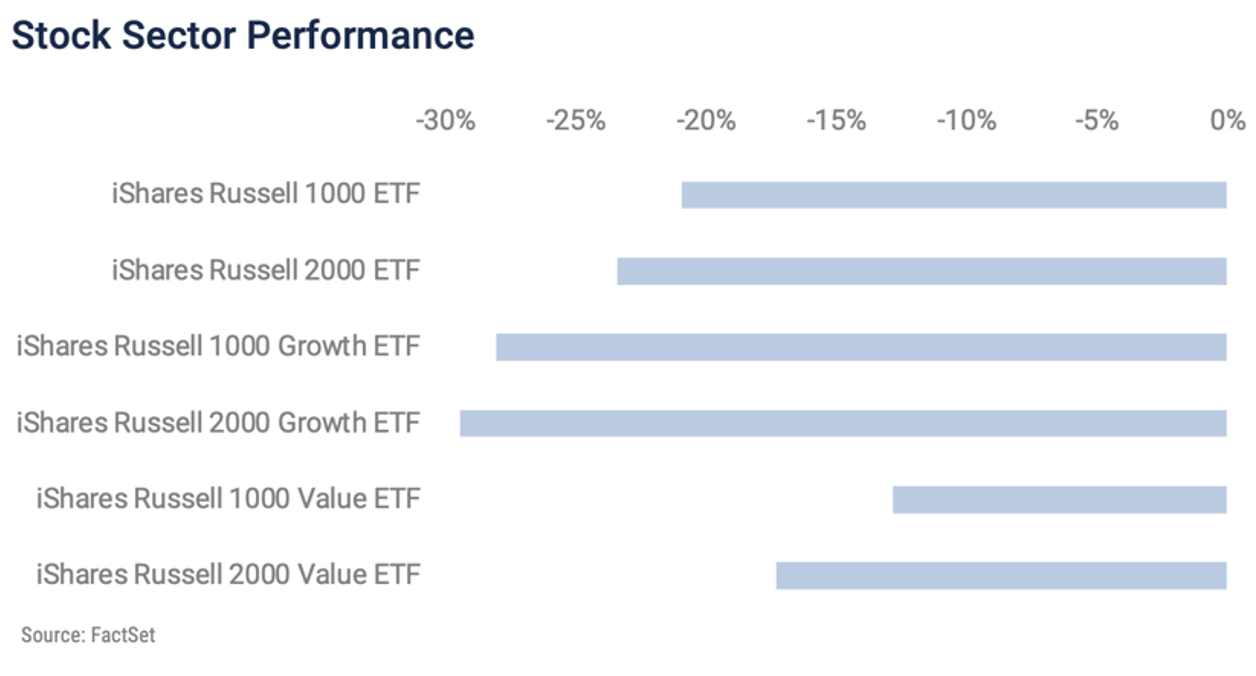
As we mentioned the S&P 500 declined 20% and other segments fared even worse with the NASDAQ Composite falling 29.5% and the Russell 2000 index of small-cap stocks down 23.4%. Cyclical stocks weighed heavily on the market benchmarks as fear of a recession supplanted inflation as investor’s primary concern, and while value stocks slightly underperformed growth stocks in June for the same reason, they maintained their edge for the quarter and year-to-date, falling less than their more expensive growth peers. The Russell 1000 Growth Index declined 20.9% in the quarter while its Value counterpart fell 12.2%.
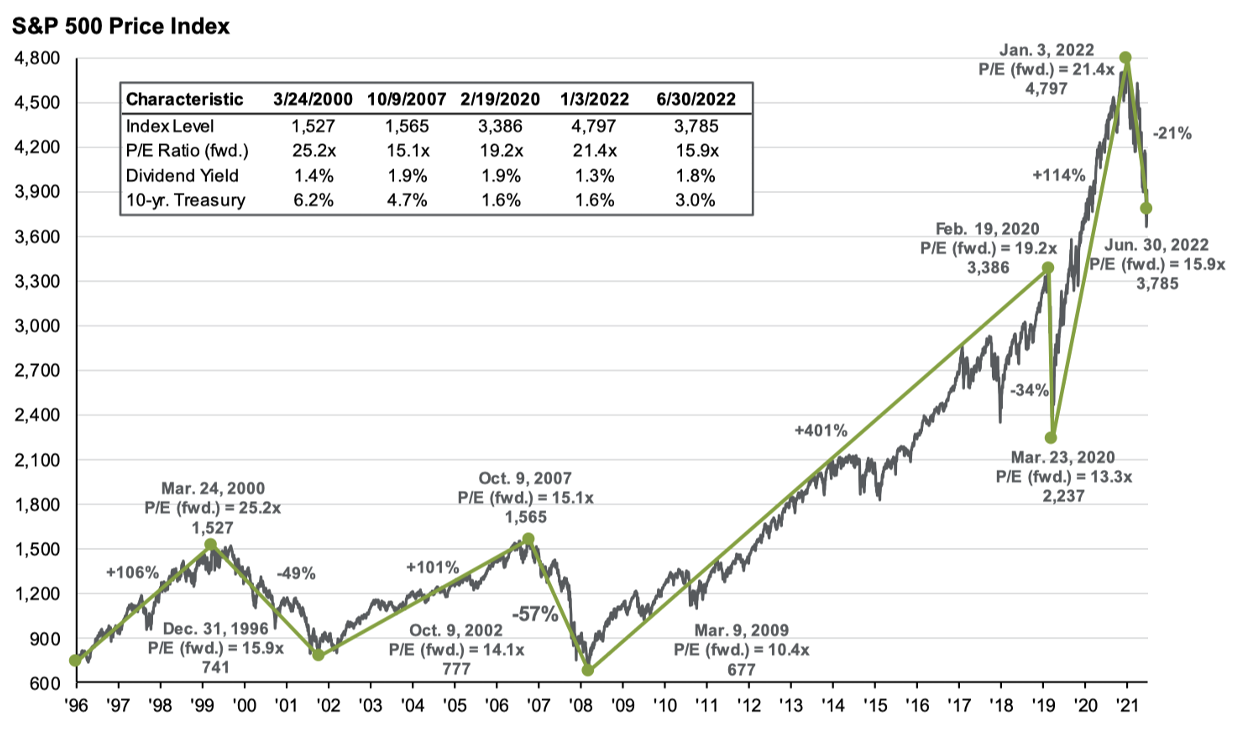
The key variable for the equity markets for the rest of the year will be the corporate earnings outlook. So far Wall Street’s equity analysts have remained positive on the prospects for corporate profits, but as the risk of recession has grown their optimism has begun to wane. According to Barron’s 71% of roughly 400 global investors surveyed by Deutsche Bank in late June expect a recession in the U.S. in 2023, up from just 29% in February, and a small but growing number expect the U.S. economy to enter a recession this year. Those rising recession expectations have not yet filtered into the earnings outlook; as it stands Wall Street estimates for S&P 500 profit growth remain in the 10% range for both 2022 and 2023, likely too optimistic if we enter even a modest recession. If the economy continues to slow and analysts revise their forecasts downward stocks will remain under pressure. Market valuations are more reasonable now than at year-end 2021, but of course those valuations are based upon the current earnings estimates.
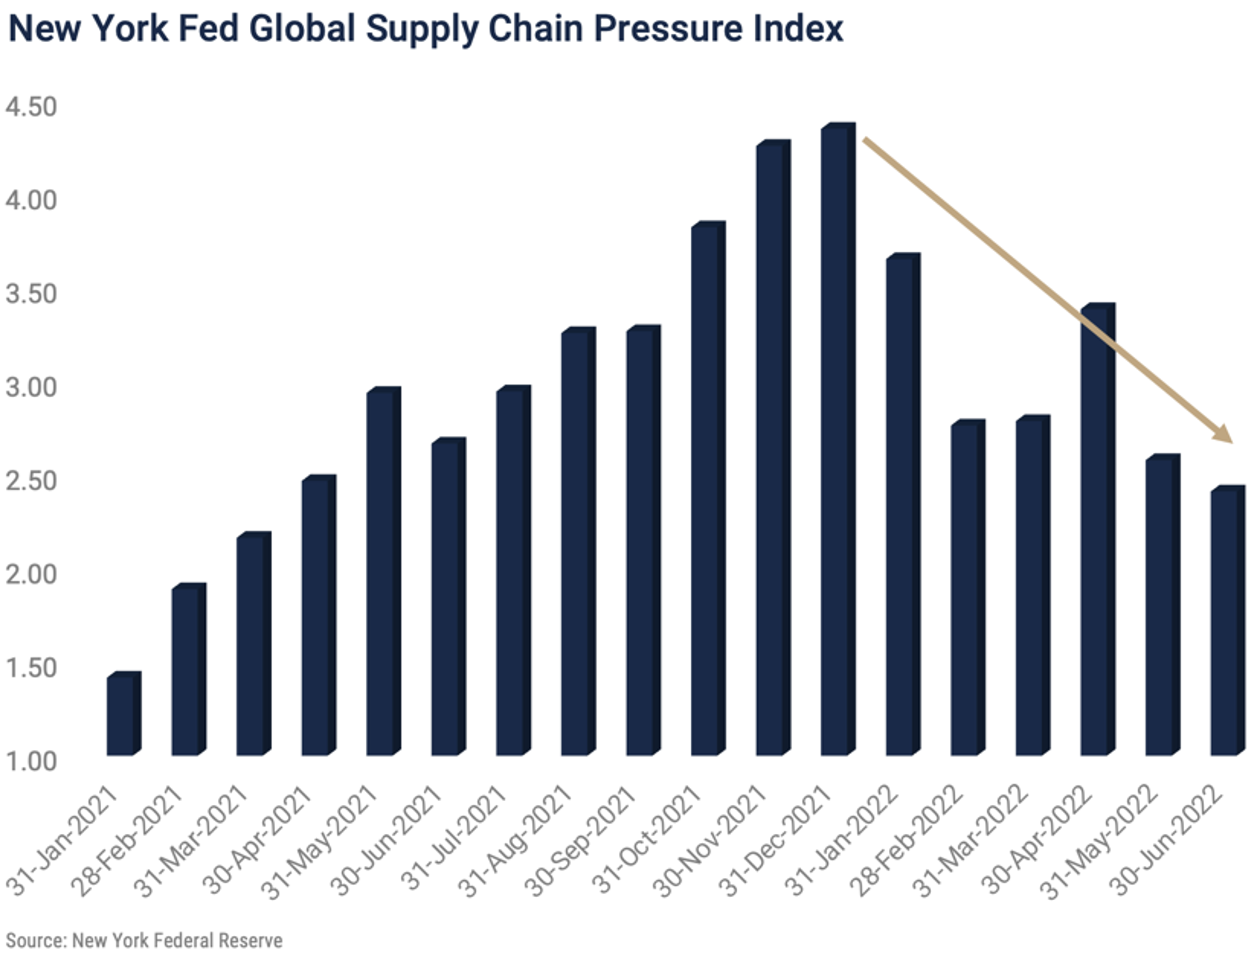
Given inflation’s central role in shaping Fed policy, interest rates, and earnings expectations, it is important to note some recent positive data points related to the inflation picture. The first is the New York Federal Reserve Global Supply Chain Pressure Index. Supply chains are still recovering from COVID-related disruptions and are analogous to a traffic jam caused by an auto accident in that they take time to clear even after the source of the backup is resolved. Fed Chair Powell cited the ongoing supply chain disruptions last December when he admitted inflation was not as “transitory” as the Fed had expected. The graph below indicates supply chain pressure peaked in December and continued lower through June.
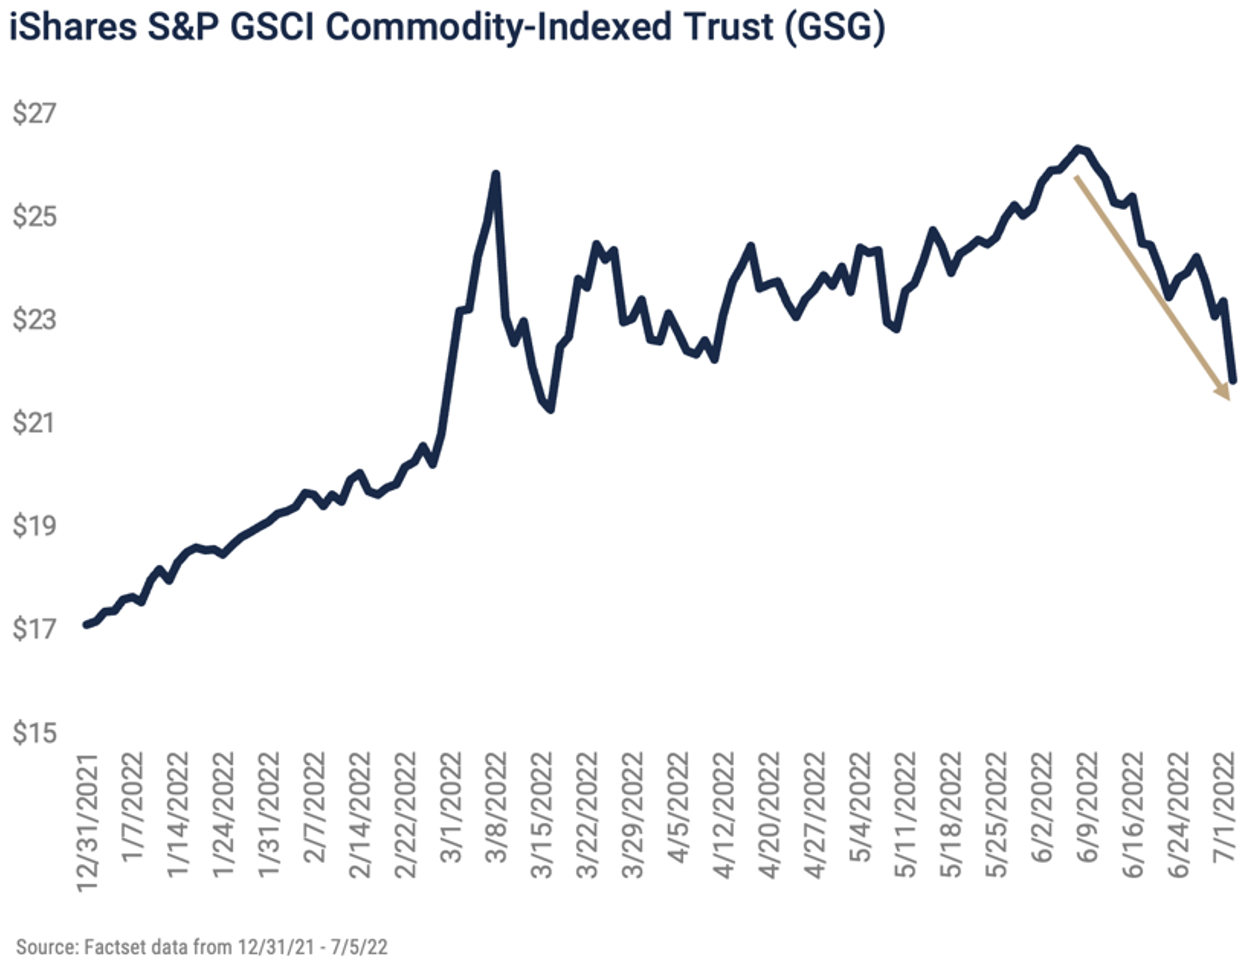
Commodity prices also appear to have peaked, and if so, could provide some important relief to the inflation pressure and support for corporate earnings. The iShares GSCI Commodity-Indexed Trust is a commodity-based fund which has shown a high correlation to interest rates. This security reached a 2022 high on June 8th and has since declined 17%. Long-term interest rates took their cue from this inflation data point and declined meaningfully over the same period, easing the downward pressure on stocks. These two inflation indicators will be important to monitor in coming weeks and months.
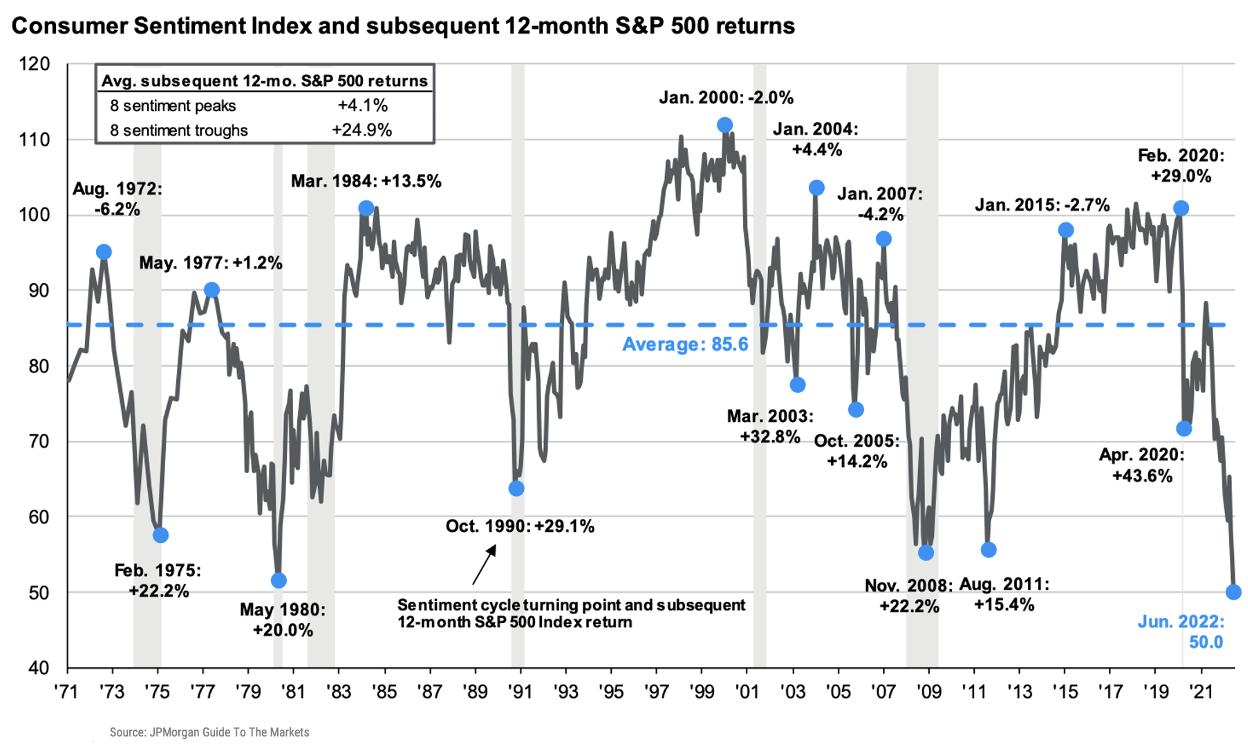
Another hopeful indicator for equity investors is the contrary message sent by the decline in consumer expectations. We mentioned that declining consumer expectations bode poorly for the economy, but stocks tend to perform well after sentiment bottoms and relatively poorly after sentiment peaks. Those trends make sense because, as we all know, investors generally make poor market timing decisions, selling into weakness rather than buying when stocks are inexpensive. This chart suggests the market may be oversold based on sentiment, in which case disciplined investors will benefit when the outlook improves and buyers return to the market.
BOND MARKET OVERVIEW
Fixed income assets suffered another agonizing month in June amid surging interest rates and unrelenting inflationary pressures. Bonds, as noted, notched their worst start to a calendar year in decades and face continued headwinds from coordinated global monetary policy tightening.
The Bloomberg Barclays Global Aggregate Bond Index posted a return of -8.3% for the quarter, extending the index’s largest drawdown on record – now down 17.9% since January 2021. U.S. bonds have fared better than their foreign peers in 2022, but the Bloomberg Barclays U.S. Aggregate Bond Index has still dropped 10.3% on a year-to-date basis. The higher-than-expected CPI data released in early June sent shockwaves through the fixed income markets and yields rose as investors anticipated the Fed’s response. As expected, the FOMC announced a 75 bps hike in the Fed Funds target rate at the June intra-month meeting, the largest policy rate increase since 1994. The FOMC’s dot plot also revealed the Committee’s continued commitment to its aggressive course, with the Fed Funds rate projected to reach 3.4% and 3.8% at the end of 2022 and 2023 respectively. As markets look ahead to the next FOMC meeting in July investors are anticipating a 50-75 bps rate hike, and the futures markets are pricing in a 100% probability of another 50 bps increase at the September meeting.
Given the backdrop of high inflation expectations and the carnage in bond prices, yields have risen to more attractive levels than we've seen in a decade. Certainly there remains a possibility of further increases in interest rates if inflation surprises to the upside, but investors can now take advantage of yields that have doubled or tripled in just six months for short-duration Treasury securities. For example, as the chart on the following page reveals, the five-year Treasury yield rose from 1.27% at the end of 2021 to 3% at the end of June. To put the magnitude of the recent rate increases in broader perspective, note the five-year Treasury yield was well under one-half of 1% at the end of 2020 during the COVID pandemic. 3% yields on two-to-five-year government bonds are very attractive to risk-averse investors and have undoubtedly drawn money from the stock market.
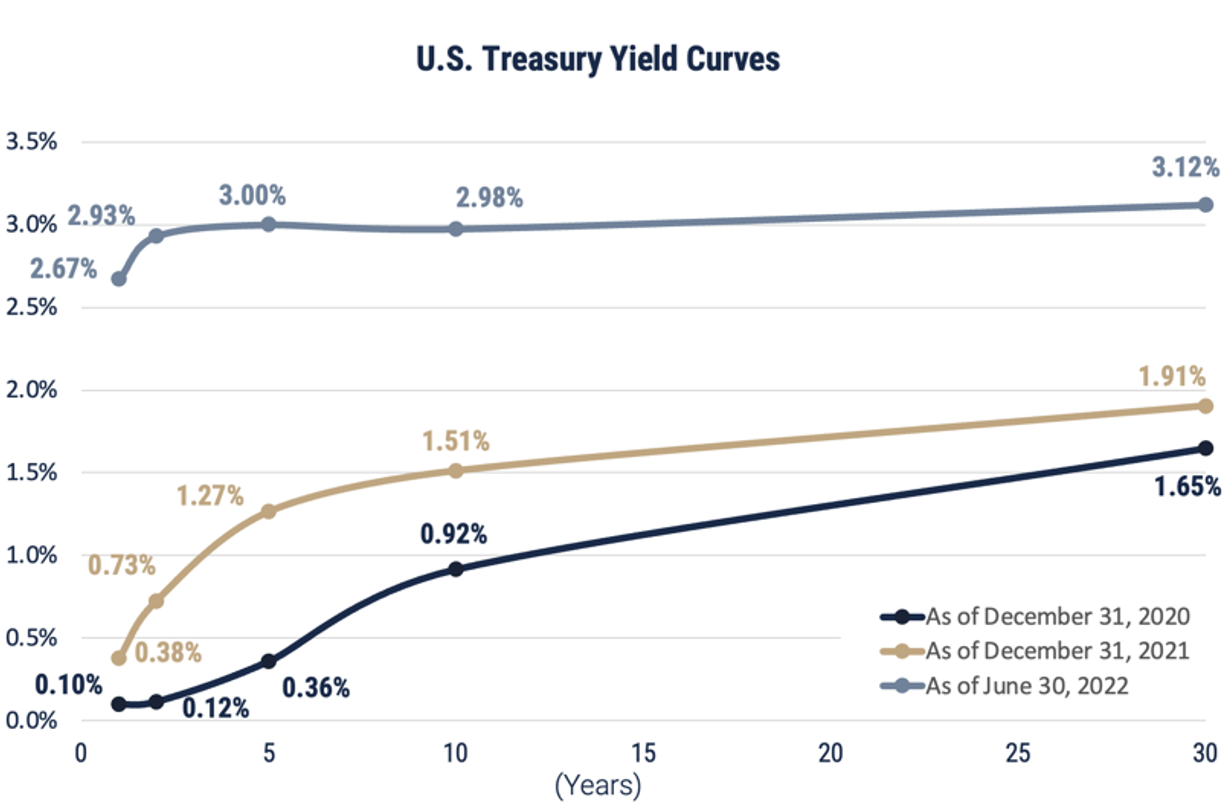
The yield curve chart also reveals the dearth of return available on longer-term bonds, so we are maintaining our conservative duration exposures. By keeping the maturity structure of bond portfolios relatively short we can protect capital in the event rates continue to rise and use the cash flows from maturities to purchase higher-yielding bonds.
THE DEATH OF THE 60%/40% PORTFOLIO?
As we mentioned at the outset the convergence of stubborn inflation, slowing economic growth, monetary tightening, rising interest rates, and heightened geopolitical risk produced the "perfect storm" for investment assets in the first half of 2022, driving both stock and bond prices down and negating the normal diversification benefit of a balanced portfolio. This stretch of negative returns has some investors thinking that “it really is different this time,” and that the classic 60/40 balanced blend no longer makes sense.
Vanguard addressed this idea with some interesting statistics in a recent study. First, recall the goal of the 60/40 portfolio, which is to achieve long-term annualized returns in the 6-7% range. The annualized return of a 60% U.S. stock/40% U.S. bond portfolio from January 1, 1926, through December 31, 2021, was 8.8%, according to the Vanguard study. Of course, that return was earned with significant volatility and included the Great Depression, World War II, the oil price shock in the 1970s, and each of the more recent financial downturns including the Internet Bubble, the Great Financial Crisis, and COVID. An important takeaway from the study is that those returns were earned with no effort to time the market at all, the strategy was simply to maintain the target mix, rebalancing periodically.
To address 2022’s performance pattern the Vanguard study compares this year’s bear market to returns for stocks, bonds, and the 60/40 blend since 1976. The results of that analysis are shown in the graph below. Surprisingly, months in which both stocks and bonds generate negative returns are common and occur roughly 15% of the time. Six-month stretches of negative performance for both asset classes are unusual but not unprecedented, occurring 3.6% of the time. The importance of patience and discipline becomes clear when we look at the longer-term results. One-year periods where both stocks and bonds generate negative returns are very rare, occurring in just 0.4% of the rolling 12-month periods since 1976, and there has never been a three- or five-year period in which both stocks and bonds declined.
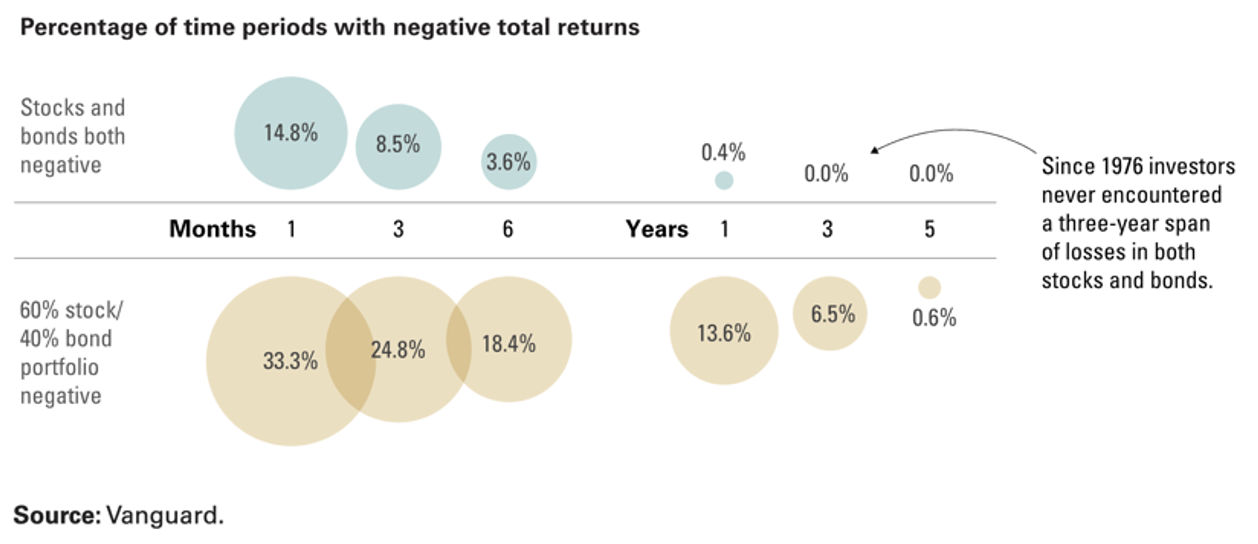
Similarly, there have been more than a few years where the 60%/40% blend has been negative; in fact, in 13.6% of those rolling 12-month periods investors had negative returns from that standard balanced asset mix. But rarely over three-year periods and almost never over a five-year period has the 60%/40% blend lost money. So, what seems to be a very rare occurrence in the first half of 2022 is in fact not unusual at all, it is simply on the low end of the range of expected returns for a mix of assets that can be expected, over time, to generate a reliable 6-7% rate of return.
Neither Vanguard nor we are endorsing a 60%/40% portfolio or any specific mix for all investors. The proper allocation for any individual, family, or institution can only be established after considering time horizon, cash flow needs, and constitutional risk tolerance, and in fact the correct strategic asset allocation mix for any client might be more aggressive or more conservative depending upon those factors. The important takeaway is that discipline and patience are the keys to long-term success in investing, a fact that can be hard to remember amid volatility like we’ve seen this year.
SUMMARY
As unpleasant as they are, the inevitable periods of poor performance in the markets provide us an opportunity to revisit the fundamentals of sound investing and to check in on each client's needs and objectives. The timeless fundamentals of diversification, thinking long-term, and avoiding emotional decisions don't obviate the need for ongoing consideration of and discussions about changes in portfolio positioning and holdings to ensure that the mix of assets held in any client’s account is aligned to meet both short and long-term objectives.
Important Notes & Disclosures
Wilbanks, Smith & Thomas Asset Management (WST) is an investment adviser registered under the Investment Advisers Act of 1940. Registration as an investment adviser does not imply any level of skill or training. The information presented in the material is general in nature and is not designed to address your investment objectives, financial situation, or particular needs. Prior to making any investment decision, you should assess, or seek advice from a professional regarding whether any particular transaction is relevant or appropriate to your individual circumstances. This material is not intended to replace the advice of a qualified tax advisor, attorney, or accountant. Consultation with the appropriate professional should be done before any financial commitments regarding the issues related to the situation are made.
This document is intended for informational purposes only and should not be otherwise disseminated to other third parties. Past performance or results should not be taken as an indication or guarantee of future performance or results, and no representation or warranty, express or implied is made regarding future performance or results. This document does not constitute an offer to sell, or a solicitation of an offer to purchase, any security, future or other financial instrument or product. This material is proprietary and being provided on a confidential basis, and may not be reproduced, transferred, or distributed in any form without prior written permission from WST. WST reserves the right at any time and without notice to change, amend, or cease publication of the information. The information contained herein includes information that has been obtained from third-party sources and has not been independently verified. It is made available on an "as is" basis without warranty and does not represent the performance of any specific investment strategy.
Some of the information enclosed may represent opinions of WST and are subject to change from time to time and do not constitute a recommendation to purchase and sale any security nor to engage in any particular investment strategy. The information contained herein has been obtained from sources believed to be reliable but cannot be guaranteed for accuracy.
Besides attributed information, this material is proprietary and may not be reproduced, transferred or distributed in any form without prior written permission from WST. WST reserves the right at any time and without notice to change, amend, or cease publication of the information. This material has been prepared solely for informative purposes. The information contained herein may include information that has been obtained from third party sources and has not been independently verified. It is made available on an “as is” basis without warranty. This document is intended for clients for informational purposes only and should not be otherwise disseminated to other third parties. Past performance or results should not be taken as an indication or guarantee of future performance or results, and no representation or warranty, express or implied is made regarding future performance or results. This document does not constitute an offer to sell, or a solicitation of an offer to purchase, any security, future or other financial instrument or product.